
The pair finished last week within a bearish tone as it managed to consolidate below the 200 SMA in the H1 chart after a sharp decline towards 1.2410. Currently, the GBP/USD pair is trying to extend such a fall to test the 1.2360 level, but the bears may get some bullish momentum and eventually it can perform a slight corrective rebound. The MACD indicator is still hovering in a negative territory.
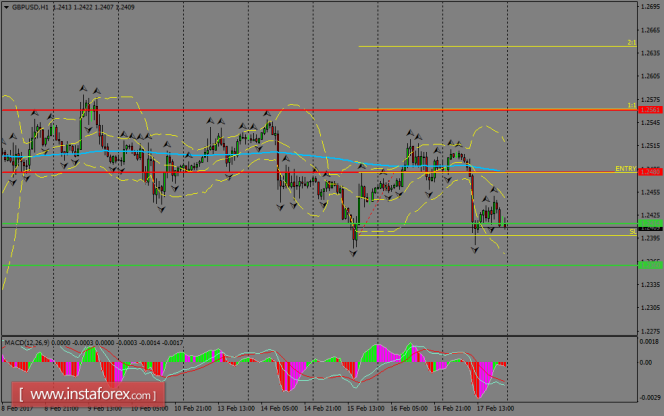
H1 chart's resistance levels: 1.2480 / 1.2561
H1 chart's support levels: 1.2414 / 1.2360
Trading recommendations for today: Based on the H1 chart, buy (long) orders only if the GBP/USD pair breaks a bullish candlestick; the resistance level is at 1.2480, take profit is at 1.2561 and stop loss is at 1.2398.
The material has been provided by InstaForex Company - www.instaforex.com