
The gold price has broken out of the ascending triangle pattern as we expected. The minimum target is at $1,300. The trend is bullish. We could see a pullback towards the $1,247-45 area, but I expect the trend to continue.
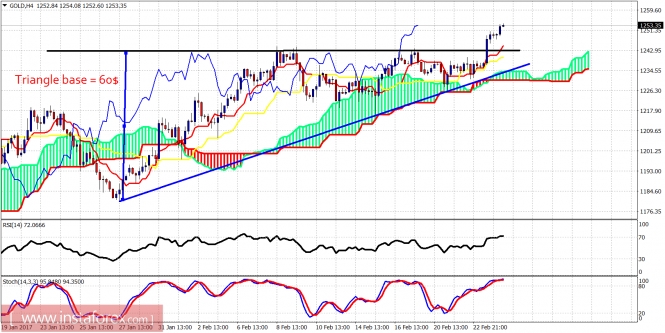
Blue line - support
The base of the ascending triangle is 60$ approximately. The break out above $1,245 should provide a similar size upward move. Therefore the target is $1,245 plus 60$ at $1,300. There are no divergence signs on the four-hour chart. I expect the uptrend to continue.
Black line -long-term resistance
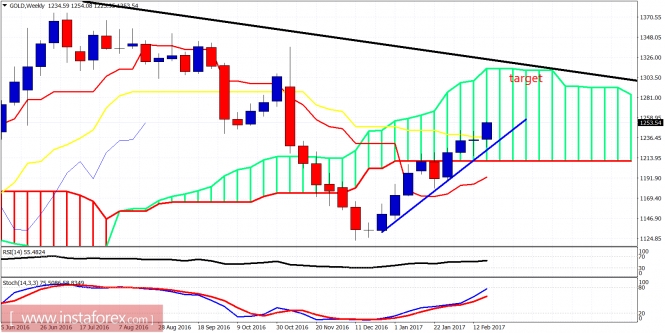
The gold price is breaking above the weekly kijun-sen (yellow line indicator). This is a very bullish sign. The oscillators have room to the upside so I expect the long-term resistance trend line to be tested. So our target of $1,300 is very possible over the coming weeks.
The material has been provided by InstaForex Company - www.instaforex.com