
The pair had a bullish session on Thursday, where it is facing the resistance zone at 1.2546. There should be some counter-trend reaction in order to correct the overall bias; and while it stays above the 200 SMA, GBP/USD could reach the 1.2633 area. The Bollinger band is showing a kind of overbought market and that's a forecast of further corrective moves to take place in the short term.
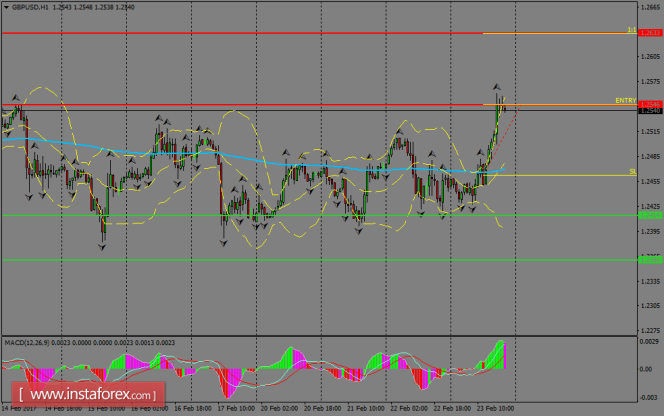
H1 chart's resistance levels: 1.2546 / 1.2633
H1 chart's support levels: 1.2414 / 1.2360
Trading recommendations for today: Based on the H1 chart, buy (long) orders only if the GBP/USD pair breaks a bullish candlestick; the resistance level is at 1.2546, take profit is at 1.2633 and stop loss is at 1.2462.
The material has been provided by InstaForex Company - www.instaforex.com