MG Network

something big isHappening!

In the mean time you can connect with us with via:

Copyright © Money Grows Network | Theme By Gooyaabi Templates

Money Grows Network

Archive

Powered by Blogger.

Welcome To Money Grows Network

Verified By

2006 - 2019 © www.moneygrows.net

Investments in financial products are subject to market risk. Some financial products, such as currency exchange, are highly speculative and any investment should only be done with risk capital. Prices rise and fall and past performance is no assurance of future performance. This website is an information site only.

Popular

Pages

Expert In

Name*


Message*

Wave analysis of USDX for January 30, 2017

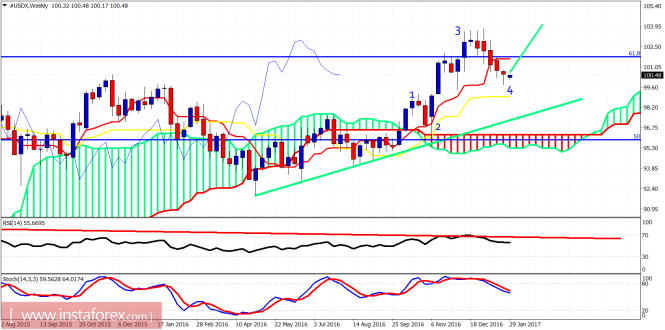
The Dollar index has made an important low last week at 99.79. This low could be a wave 4 low and we could be now at the early stages of wave 5 up targeting 105-106. In the short-term term price has given bullish reversal signals.

analytics588ef2614d639.png

Blue lines - bearish channel

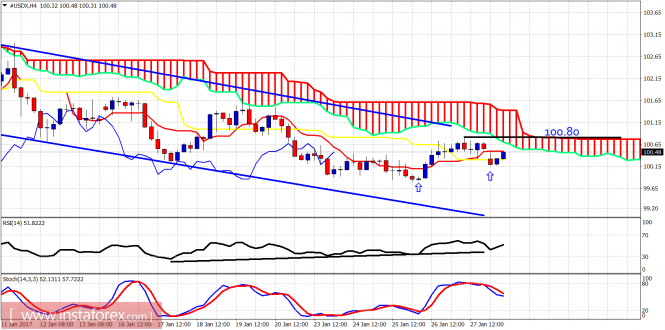
Black line - resistance at 100.80

The Dollar index is still below the Ichimoku cloud and inside the bearish channel but since last week we have bullish reversal signs and bullish divergence signs in the RSI. Short-term resistance is at 100.80. Support is at 100.15. A break above resistance will push the index towards 101.15 at least.

analytics588ef2d77f165.png

On a weekly basis price could already have completed a wave 4 correction at last week's low which is also depicted by a bullish hammer candlestick pattern. Price has important long-term resistance levels at 101.80 and at 103 next. Breaking above these levels will strengthen the bullish scenario looking for 105-106. Worst case scenario is a move towards 102, a lower high and the creation of a right hand shoulder for a H&S pattern with the neckline at 99.80.The material has been provided by InstaForex Company - www.instaforex.com