
The index stayed in a sideways range around the 200 SMA at H1 chart, looking to reach the resistance level of 101.43, as it already found a bottom at the 100.00 psychological zone across the board. If USDX manages to break above that resistance, we can expect a bullish week that put us in focus to target the 102.39 level as the next key area to the upside.
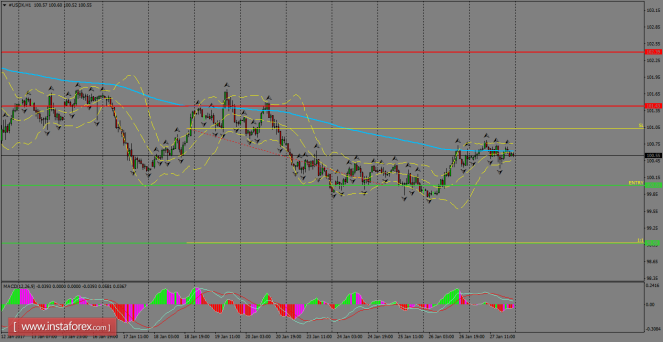
H1 chart's resistance levels: 101.43 / 102.39
H1 chart's support levels: 100.01 / 98.98
Trading recommendations for today: Based on the H1 chart, place sell (short) orders only if the USD Index breaks with a bearish candlestick; the support level is at 100.01, take profit is at 98.98 and stop loss is at 101.03.
The material has been provided by InstaForex Company - www.instaforex.com