
Last Friday, the USD/JPY pair tried to break above the resistance of the MACD indicator line and the daily price channel line (green) for the third time in three days. It failed once again and ended the day with a decline of 29 points.
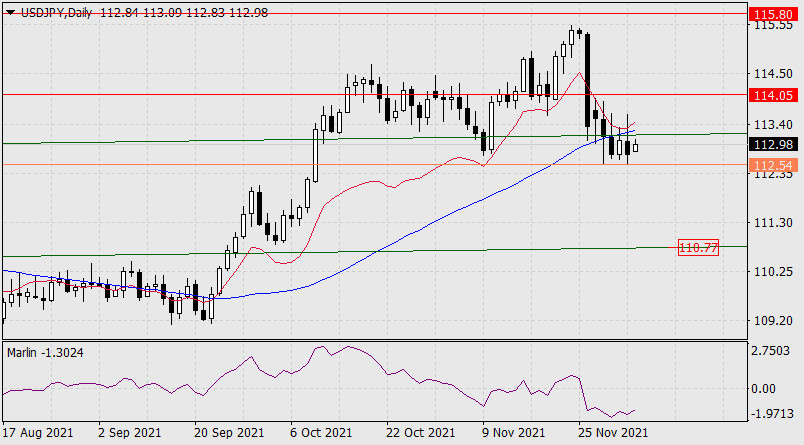
Now we see that with the support of the declining Marlin Oscillator in the negative zone, the price is trying to overcome the signal support at 112.54. If this happens, then with the greatest probability, the price will go further down to the target of 110.77 - to the lower embedded line of the price channel.
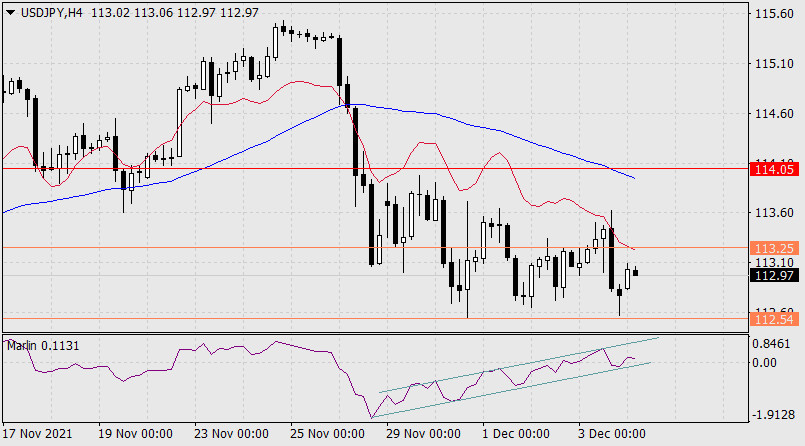
The technical picture is more complex on the H4 chart. The signal line of the Marlin Oscillator turned upward from the lower border of its own channel, and the line itself is already in the positive area. This is a sign of price growth towards overcoming resistance at 113.20, which corresponds to the MACD line on the daily chart. This will be another exit above this line, and it may no longer be false - the 114.05 target level will be overcome.
A decline below 112.54 will automatically mean that the oscillator will exit from its ascending channel to the downside. We are waiting for the development of events.
The material has been provided by InstaForex Company - www.instaforex.com