
Weekly
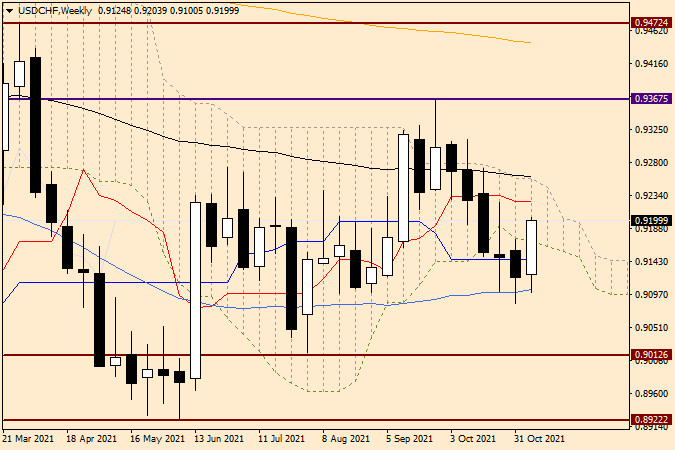
As we can see, the Swiss franc strengthened against the US dollar in trading on November 1-5, but there are some significant points to bear in mind. First, last week the pair failed to close below the 50 simple moving average, which is at one of the strongest technical levels of 0.9100. The previous five-day trading closed above this level. Secondly, the previous weekly candlestick had formed a rather impressive lower shadow. Both of these factors should have alerted the sellers and led to at least partial closing of short positions on this trading instrument. Apparently, that's exactly what happened and at the moment the pair is rising steadily, trading close to another significant level, 0.9200. If the bulls don't loosen their grip and the rally continues, the pair will test the red Tenkan line, which is at 0.9225. A weekly close above the Tenkan would create further prerequisites for an upside move of the Ichimoku cloud. However, the 89 black exponential moving average, which is just above the upper boundary of the cloud, is also worth considering.I assume that 89-EMA could provide additional and quite strong resistance to the price. Therefore, conclusions about the subsequent northward movement of the pair can only be drawn after a true upward move of the cloud and a breakdown of the 89-exponent. In this case, the path will open to another important, if not the key, resistance level, 0.9367. All this can be seen on the weekly price chart. For the bears, the main goal at the moment is to break the 50-MA and the 0.9100 level. Judging by the fact that the USD/CHF market is now clearly bullish, the upside prospects outweigh the possibility of a downside scenario.
Daily
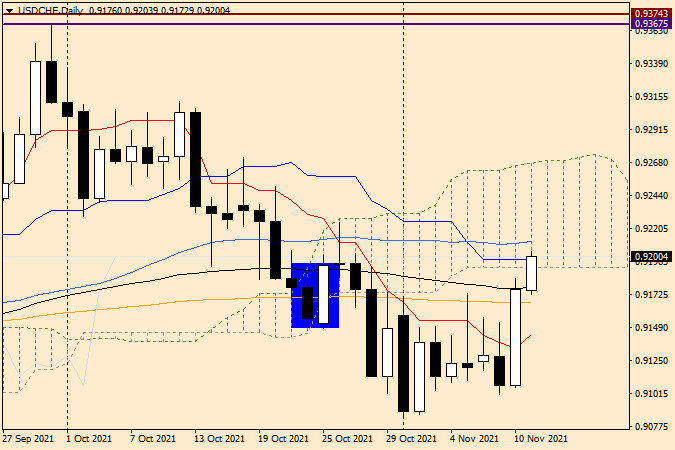
The USD/CHF pair broke through the red Tenkan line of the Ichimoku indicator as a result of yesterday's strong upward movement, followed by a breakout of the orange 200 exponential moving average and closing the November 10 session above the 200-EMA. This probably creates good prerequisites for a further rise in the price. However, in order to do so, it is necessary to break through the blue Kijun line and enter the boundaries of the Ichimoku cloud. This is exactly what the bulls are doing. However, a little higher, at 0.9211, there is also the 50-MA, which may also resist the pair in its bid to continue moving northwards.
Summary and trading recommendations
Due to the massive strengthening of the US dollar, an upward scenario, or more precisely a continuation of this scenario, seems most likely. However, the current technical picture is not the most favourable for opening long positions. We should wait for a true breakdown of 0.9200 and 50-MA (0.9211) and then, on a pullback into the 0.9215-0.9200 price range, consider options for opening purchases. To sell, you must wait for clear bearish candlestick analysis signals.
The material has been provided by InstaForex Company - www.instaforex.com