
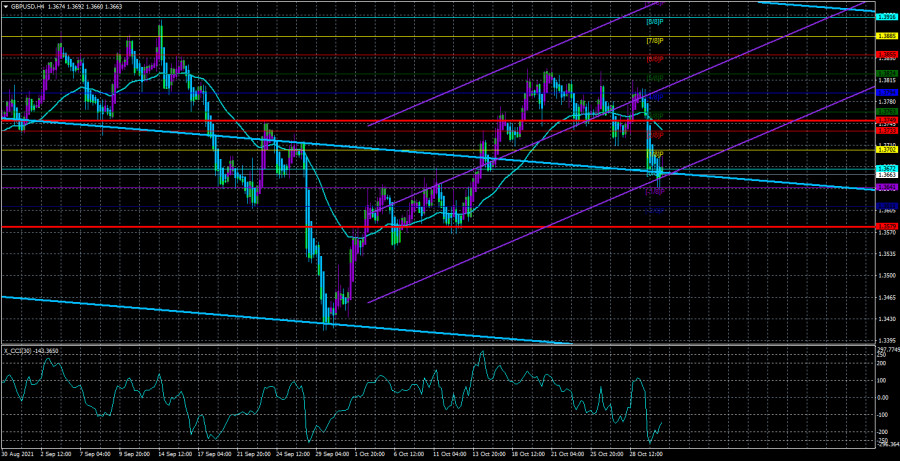
4-hour timeframe
Technical details:
Higher linear regression channel: direction - downward.
Lower linear regression channel: direction - upward.
Moving average (20; smoothed) - downward.
The GBP/USD currency pair traded extremely calmly on Monday. At first, traders tried to continue selling the pair, but in the afternoon, an upward pullback began. Thus, on the 4-hour timeframe at this time, everything looks like a simple correction against the upward trend that has been forming in the last few weeks. To understand what the main trend is now (since it is visible on the 4-hour TF that trends change too often), you need to switch to the 24-hour TF. We analyzed it in detail over the weekend, and now we will just remind you how things are. The downward trend persists there, but it is so weak, and the corrections within it are so strong that this whole trend, which has been observed for more than six months, looks like a banal correction. Last week, the price once again failed to gain a foothold above the Ichimoku cloud on the 24-hour TF, so the pound's ascent stopped on the 4-hour TF. As for the fundamental reasons for the current movement, everything is even more complicated and incomprehensible here than with the technical picture. It was like that a week or two ago. However, this week, there will be two meetings of central banks at once. Naturally, no one can now say with absolute probability what and how they can end. Anything can happen. The same Bank of England may come closer to curtailing its quantitative stimulus program (if the number of members of the monetary committee supporting this decision increases from the current 2). And this is a bullish factor for the pound. The Fed may announce the beginning of the curtailment of the QE program, and this is a bullish factor for the dollar. And in addition, the next Nonfarm Payrolls report will be published this week. Thus, the movement of the pound/dollar pair, which in principle has not differed in particular logic in movements lately, can be anything.
Britain does not like it when someone violates the terms of a trade agreement.
Well, a new week for the British pound began with a new conflict involving the United Kingdom. Earlier, Britain only in 2021 repeatedly entered into skirmishes with the European Union. There were a lot of reasons. This is the "Northern Ireland protocol", and London's violation of some provisions of the Brexit deal, incomprehensibility in the issue of fishing quotas in British waters. The last question was the cause of a new conflict, this time personally with France. It turned out that Paris is ready to impose sanctions against the Kingdom because of alleged violations of the Brexit agreement. In France, it is believed that French fishermen were granted half as many fishing licenses in British waters as the country required. But in the UK, France's demands are considered overstated and do not comply with the terms of the Brexit agreement. As a result, the UK demanded that France abandon its claims regarding fish quotas and was given 48 hours to do so. This was stated by the Minister of Foreign Affairs of the United Kingdom Elizabeth Truss. "If one of the parties to a trade transaction behaves dishonestly, you have the right to take action against him and demand compensation for violation of the agreement. This is exactly what we will do if the French does not back down in the next 48 hours," Truss said. As it turns out now, Britain does not like it when someone violates the agreement (unless, of course, it is not the Kingdom itself). Previously, the European Union has repeatedly applied accusations to the UK that it violates or does not comply with the terms of the Brexit agreement. However, it seems that the agreement itself is too inaccurate, so either side can interpret it as it pleases. Perhaps only the general provisions and the most important figures are written there, but the details are not. Recall that this agreement was signed literally at the New Year's table. Therefore, it is not surprising that as soon as it came into force, so many problems with it immediately arose.
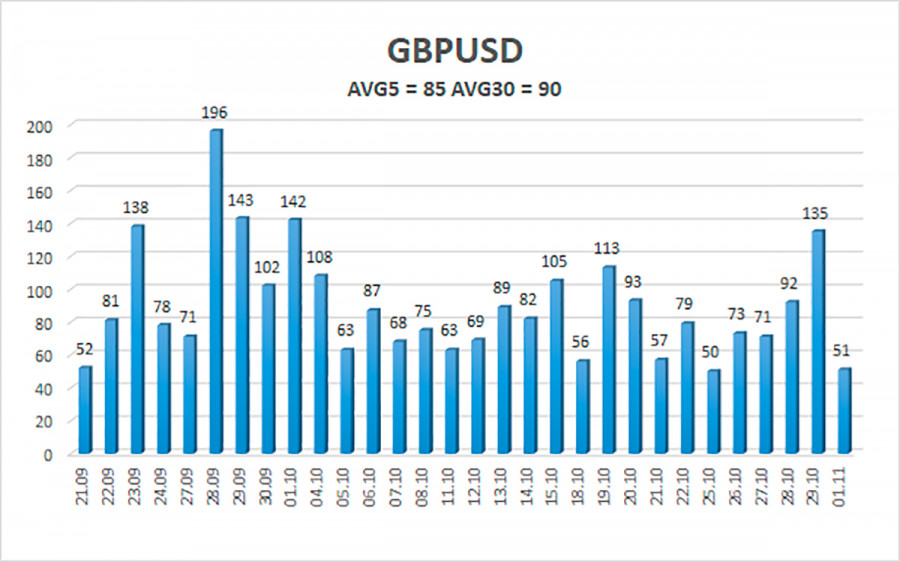
The average volatility of the GBP/USD pair is currently 85 points per day. For the pound/dollar pair, this value is "average". On Tuesday, November 2, we expect movement inside the channel, limited by the levels of 1.3579 and 1.3749. The upward reversal of the Heiken Ashi indicator signals a round of corrective movement.
Nearest support levels:
S1 – 1.3641
S2 – 1.3611
Nearest resistance levels:
R1 – 1.3672
R2 – 1.3702
R3 – 1.3733
Trading recommendations:
The GBP/USD pair continues to be below the moving average on the 4-hour timeframe, so the trend remains downward. Thus, at this time, it is necessary to keep open short positions with targets of 1.3611 and 1.3579 levels until the Heiken Ashi indicator turns upwards. Buy orders can be considered again if the price is fixed above the moving average line with targets of 1.3763 and 1.3794 and keep them open until the Heiken Ashi turns down.
Explanations to the illustrations:
Linear regression channels - help determine the current trend. If both are directed in the same direction, then the trend is strong now.
Moving average line (settings 20.0, smoothed) - determines the short-term trend and the direction in which to trade now.
Murray levels - target levels for movements and corrections.
Volatility levels (red lines) - the likely price channel in which the pair will spend the next day, based on current volatility indicators.
CCI indicator - its entry into the oversold area (below -250) or into the overbought area (above +250) means that a trend reversal in the opposite direction is approaching.
The material has been provided by InstaForex Company - www.instaforex.com