
EUR/USD 5M
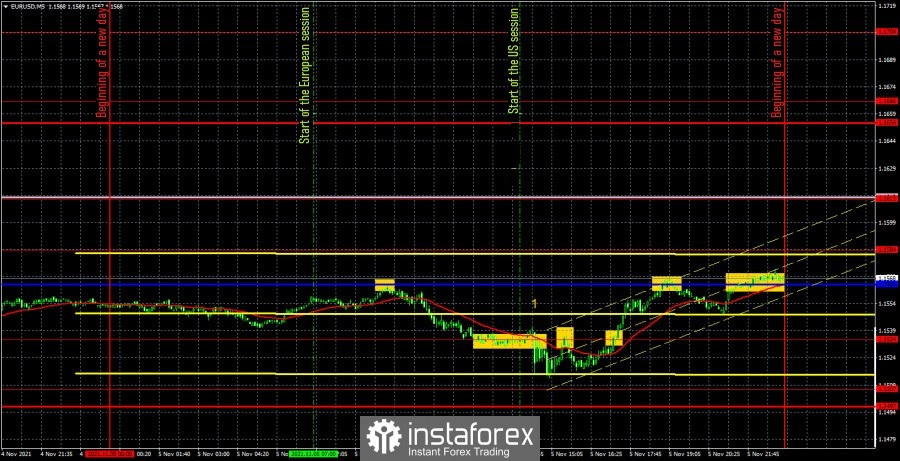
The EUR/USD pair first dropped by 60 points during the last trading day of the week, updating its annual lows by several points, and then the same-sized upward movement, returning to the Kijun-sen line. In principle, Friday was reduced to only one event – a report on Nonfarm Companies in the US. Recall that two days before this report, the Federal Reserve announced its decision to begin curtailing the quantitative stimulus program. Accordingly, it could be assumed that the Fed is waiting for an increase in the number of Non-Farms after two failed months. And so it turned out in practice. The report turned out to be 80,000 higher than the forecast value, but it did not matter for the US dollar, because all it managed to show after this publication was a 20-point increase. However, before that, almost from the very beginning of the European trading session, the pair's quotes had already been falling, so we can also assume that the markets had already started to win back the yet-to-be-published report. In this case, the movement of the pair is logical, since when the expectations were confirmed, profit-taking on short positions began. The figure "1" in the chart marks the time of not only the Nonfarm report, but also unemployment and wages in the United States. All of them turned out to be better than the analysts' expectations. And all of them did not help the US currency to continue strengthening. Now let's look at the trading signals. The first one was formed at the beginning of the European session, but in fact there was no such signal, since the Kijun-sen line later dropped to this level, as can be seen on the 4-hour TF. Then three signals were formed near the level of 1.1534, the first two should be ignored. They were formed too close in time to the publication of important statistics in the United States. But the third buy signal could be worked out, and it allowed to earn about 16 points, since the price could not go above the critical line. The last two sell signals in the form of bounces from the Kijun-sen line should not have been worked out either, since they were formed too late.
EUR/USD 1H
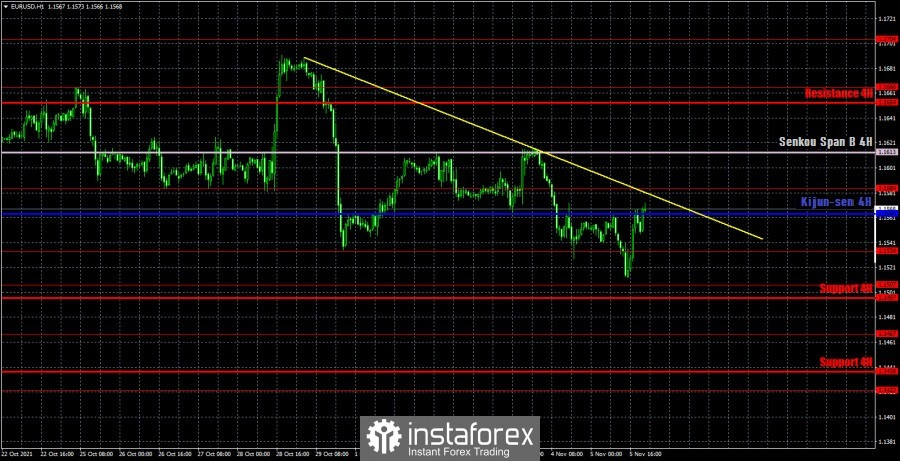
A downward trend and a trend line have finally formed on the hourly timeframe, but there is a feeling that it will not last long. On the higher timeframes, it is clearly visible that at this time the pair is moving more sideways than down. Nevertheless, a rebound from the trend line may trigger a new round of downward movement. And overcoming this line is a new round of the ascending. On Monday, we highlight the following levels for trading - 1.1507, 1.1534, 1.1584, 1.1666, as well as the Senkou Span B(1.1613) and Kijun-sen(1.1564) lines. The lines of the Ichimoku indicator may change their position during the day, which should be taken into account when searching for trading signals. Signals can be rebounds or breakthroughs of these levels and lines. Do not forget about placing a Stop Loss order at breakeven if the price moves 15 points in the right direction. This will protect you against possible losses if the signal turns out to be false. Not a single important fundamental event or macroeconomic publication will take place in the European Union and the United States on November 8. Thus, there is reason to believe that volatility will be very weak today, and there will be no intraday trend movement.
We recommend you to familiarize yourself:
Forecast and trading signals for GBP/USD for November 8. Detailed analysis of the movement of the pair and trade deals.
Analysis of the COT report
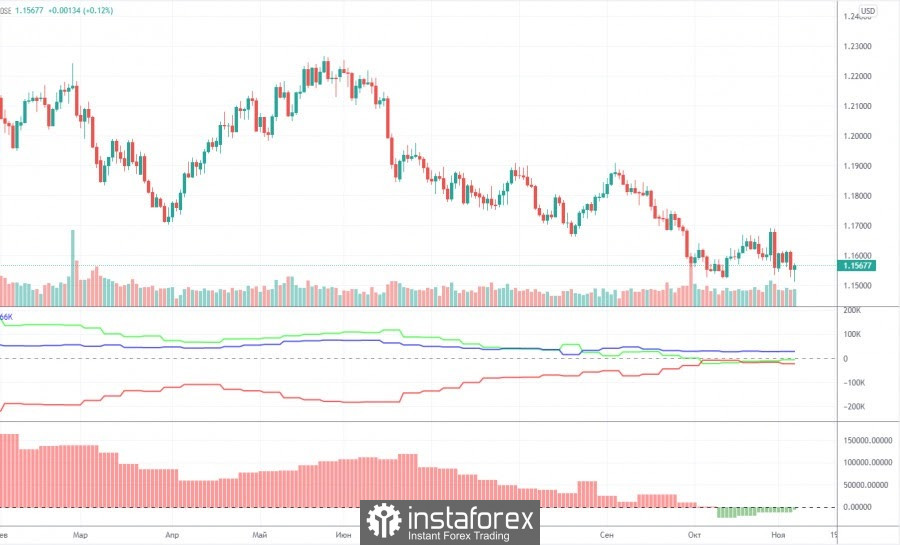
The mood of non-commercial traders changed, but not much, during the last reporting week (October 26-November 1). A group of "non-commercial" traders closed 4,000 buy contracts (longs) and 10.5 thousand sell contracts (shorts) during the reporting week. Consequently, the net position of professional players has grown by 6.5 thousand, which is not so much. However, the changes in the mood of non-commercial traders are best seen by the first indicator in the chart above. The red and green lines have been moving towards each other for a long time, and in the last couple of months they have been almost at the same level. This suggests that the previous trend is ending, and the mood of the major players at this time is as neutral as possible. This is confirmed by the data on the total number of contracts. The "non-commercial" group has 195,000 buy contracts (longs) and 199,000 sell contracts (shorts). The commercial group has 418,000 buy contracts and 442,000 sell contracts. That is, as we can see, the numbers are almost the same. Therefore, there are theoretical chances for the continuation of the downward movement in the pair. The trend began to end (an upward trend) when the red and green lines (net positions of the "commercial" and "non-commercial" groups) began to narrow. That is, for quite a long time. And now, logically, the downward trend continues. However, this "trend" is still not too similar to the trend. Rather, a banal three-wave correction.
Explanations for the chart:
Support and Resistance Levels are the levels that serve as targets when buying or selling the pair. You can place Take Profit near these levels.
Kijun-sen and Senkou Span B lines are lines of the Ichimoku indicator transferred to the hourly timeframe from the 4-hour one.
Support and resistance areas are areas from which the price has repeatedly rebounded off.
Yellow lines are trend lines, trend channels and any other technical patterns.
Indicator 1 on the COT charts is the size of the net position of each category of traders.
Indicator 2 on the COT charts is the size of the net position for the non-commercial group.
The material has been provided by InstaForex Company - www.instaforex.com