
Wave pattern
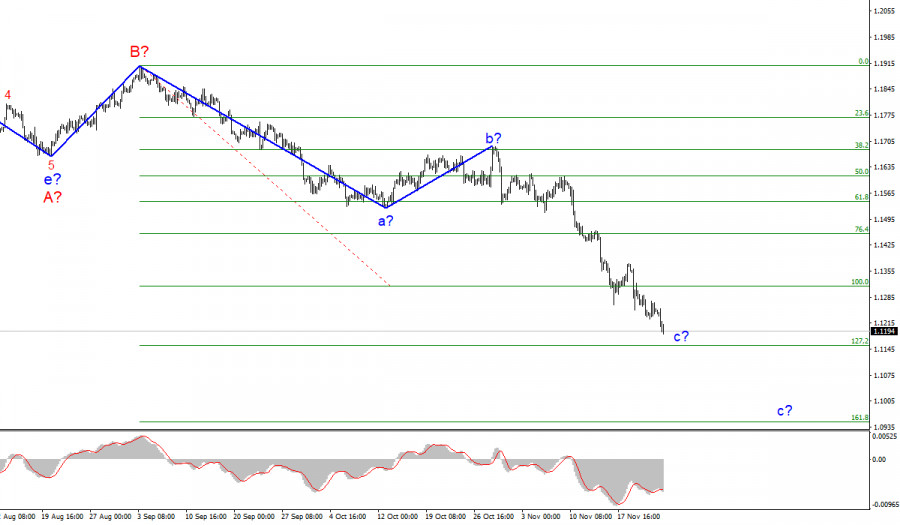
The wave layout for EUR/USD on the 4-hour chart remains complete and does not require any changes. The a-b-c-d-e section of the trend, which was formed at the very beginning of the year, should be interpreted as a wave A, and the subsequent rise in the instrument is seen as a wave B. Thus, the formation of the assumed wave C continues, and it can take a very extended form. If the current wave layout is correct, then the construction of the supposed wave c in C is in progress. The entire C wave may turn out to have a five-wave structure. The targets are located near the estimated mark of 1.1153 which corresponds to 127.2% Fibonacci. This wave, however, may take on a longer form with a target around 1.0949. A successful attempt to break through the 1.1314 level will indicate that markets will stay bearish on the instrument. A failed attempt to break through the 1.1153 mark could signal the end of the formation of wave c in C.
New Covid wave sweeps across several EU countries
On Wednesday, the news background for the EUR/USD pair was rather weak for the euro but significant for the US currency. However, it did not have any strong influence on the market sentiment. The demand for USD remained quite high although the economic data from the US was not so positive. At the moment, markets are more focused on the coronavirus news rather than economic ones. This is especially true for Europe. Of course, people get infected and die from Covid in the US as well. Yet, in some EU countries, new infection cases have already exceeded the peaks of the second and third waves and continue to rise. Health care officials and lawmakers blame the anti-vaccination movement for the resurgence of the new Covid wave. The problem is especially acute in Germany, EU's largest economy. The incidence rate in Germany has hit 400 new infections per 100,000 people, which is quite a lot. This means that around 50-60K people get infected every day. At the same time, the vaccination rate in Germany stands at 68%, which is lower than in other EU countries. For example, in Spain, it is 80%. Therefore, the incidence rate in Spain is 70 new cases per 100,000 people. That is, 6 times lower than in Germany. Besides, the so-called revaccination, or vaccination with the third booster dose, is going very slowly. It is believed that in Israel, for example, they were able to avoid the introduction of a lockdown thanks to an effective revaccination campaign. So, in the near future, Germany is going to tighten measures to counter the coronavirus spread. Let me remind you that a nationwide lockdown has been introduced in neighboring Austria, and unvaccinated people are prohibited from going out for any reason.
Conclusion
Based on the analysis above, I can conclude that the construction of the descending wave C will continue. Therefore, I will advise you to sell the instrument, following each sell signal of the MACD indicator with the targets located near the estimated level of 1.1153, which corresponds to 127.2% Fibonacci, and below it. An unsuccessful attempt to break through the 1.1153 level may indicate that a corrective wave is about to start its formation.
Higher time frame
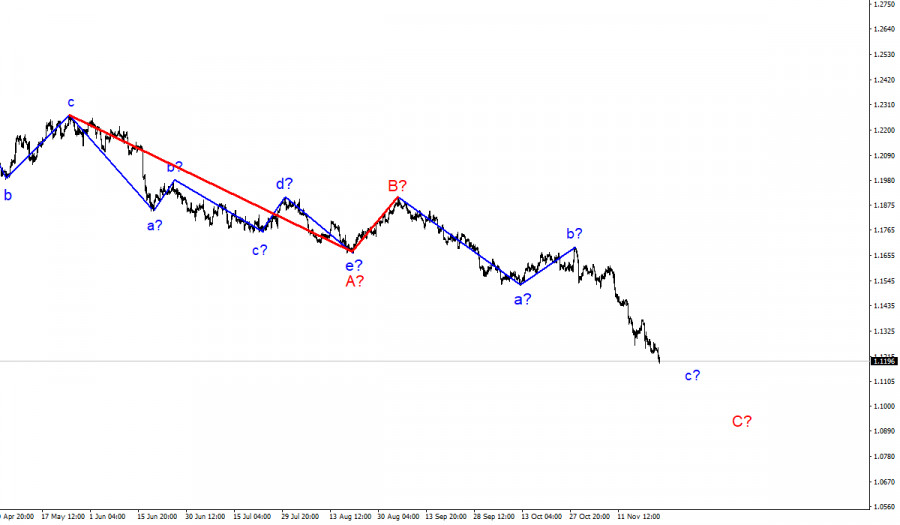
The wave layout on the higher time frame looks quite convincing. The quotes continue to move lower. The descending section of the trend that was initiated on May 25 takes the form of a three-wave correctional pattern A-B-C. This means that the downtrend may continue for another month or two until the wave C is fully completed. It can have either a three- or a five-wave structure.
The material has been provided by InstaForex Company - www.instaforex.com