
GBP/USD 1H
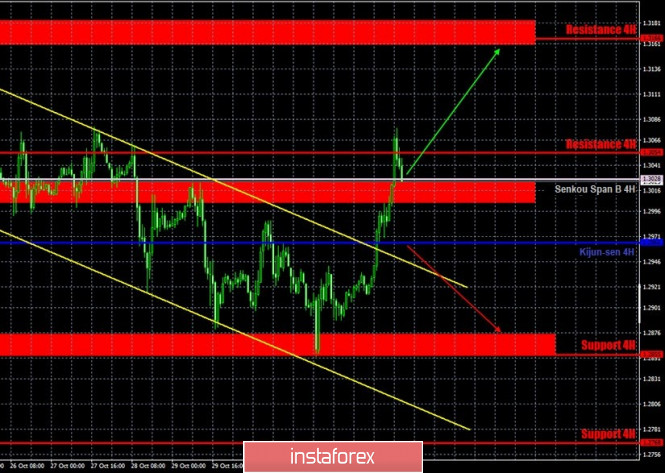
The GBP/USD currency pair also traded in different directions all day on November 4. Therefore, it is also extremely difficult to predict the pound/dollar pair's movement. The technical picture for this pair looks much more ambiguous than for the euro/dollar. In fact, trading is now taking place in the area of the Kijun-sen, Senkou Span B lines and the resistance level of 1.3054. In theory, if the price settles above all three lines, then buyers can become active and try to pull the pair towards the 1.3166 resistance level. And if they settle below all three lines, sellers may try to direct the pair to the support area of 1.2855-1.2875. However, recent attempts by bulls and bears to achieve their goals have not been crowned with success. Thus, today's attempts to reach these goals might not be successful. Therefore, you should be very careful with any position. The markets are still overly agitated.
GBP/USD 15M
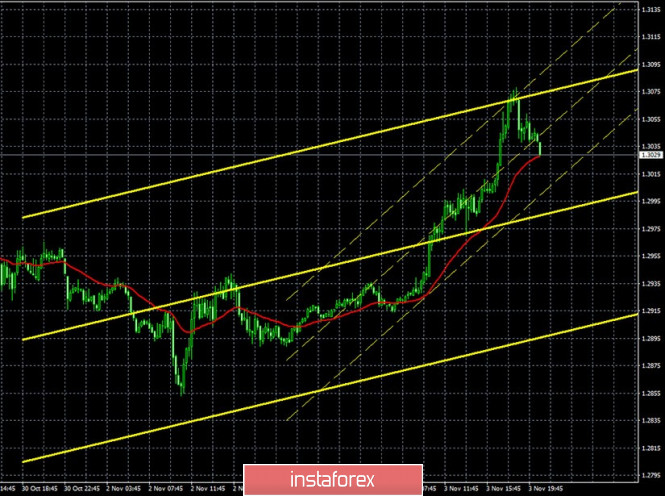
The linear regression channels are directed in different directions on the 15-minute timeframe, which fully corresponds to the nature of the pair's movement on the hourly chart. For now, we recommend waiting for the markets to calm down.
COT report
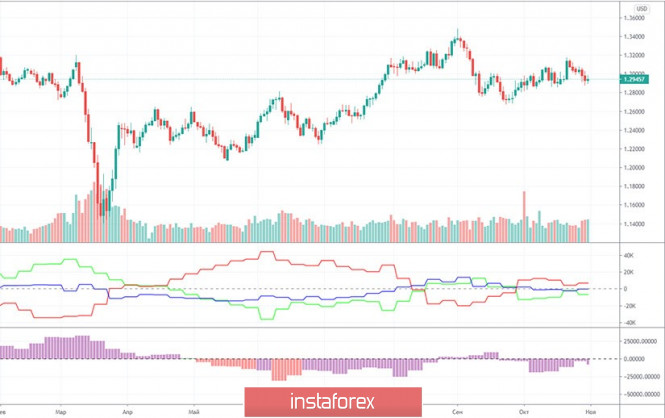
The latest Commitments of Traders (COT) report on the British pound showed that non-commercial traders were quite active in the period from October 20-26. However, their sentiment changed again, as can be seen from the green line of the first indicator in the chart. The mood of the "non-commercial" group of traders became more bullish for three consecutive weeks, but the net position decreased by 5,000 contracts over the last reporting week, so we can conclude that professional traders are again inclined to sell off the pound. However, if you look at the COT reports over the past few weeks or look at the first indicator, it becomes clear that commercial and non-commercial traders do not have a clear trading strategy right now. Perhaps this is due to an extremely unstable and complex fundamental background. The fact remains. The pound lost 90 points in recent trading days, and we believe that it will continue to fall. However, in the near future, we might receive important information about the progress of negotiations on the UK-EU trade deal, and the results of the vote for the US president will also become known. This information can change the mindset of professional traders. You need to be prepared for this.
No fundamental background for GBP/USD on Wednesday, except for the data on the US elections, on the basis of which the pair was trading all day. Again, no important information from the UK about the progress of the negotiation process between Michel Barnier and David Frost, although talks have been underway for almost two weeks, and they should have ended last week. Yesterday, too, the parties were supposed to make statements about the progress achieved (or about another failure), but they did not provide any information. Meanwhile, the deadline for November 15 is approaching... The index of business activity in the service sector was published in the UK, which fell (to 51.4), but remained above the 50.0 level. The Bank of England is set to hold a meeting today, at which it may decide to expand the quantitative stimulus program by 100 billion pounds. At the same time, the rates are likely to remain unchanged. And late in the evening, the Federal Reserve will sum up the results of its two-day meeting, but everything is easier here, since no changes in monetary policy are expected. Speeches by Andrew Bailey and Jerome Powell may provide the markets with a lot of new information, and in addition to these important events, we might receive information on the US presidential elections or (finally !!!) on the negotiations on the EU-Britain trade deal. In general, the fundamental background can be extremely strong in certain scenarios. This means that the volatility of the pair can also be high.
We have two trading ideas for November 5:
1) Buyers of the pound/dollar pair failed to develop their success, and in principle, now none of the market participants has an advantage. Thus, if the bulls manage to gain a foothold above the 1.3054 level, then you can try to buy in small lots while aiming for the resistance level of 1.3166, but be careful. Take Profit in this case will be up to 90 points.
2) Sellers also don't own the market right now. Thus, you can try to open new sell orders while aiming for 1.2855–1.2874 if the price settles below the Kijun-sen line (1.2996), but also in small lots and be careful. Take Profit in this case can be up to 100 points. Take note that we should brace for highly volatile trading and sharp price reversals for today just in case.
Hot forecast and trading signals for EUR/USD
Explanations for illustrations:
Support and Resistance Levels are the levels that serve as targets when buying or selling the pair. You can place Take Profit near these levels.
Kijun-sen and Senkou Span B lines are lines of the Ichimoku indicator transferred to the hourly timeframe from the 4-hour one.
Support and resistance areas are areas from which the price has repeatedly rebounded off.
Yellow lines are trend lines, trend channels and any other technical patterns.
Indicator 1 on the COT charts is the size of the net position of each category of traders.
Indicator 2 on the COT charts is the size of the net position for the "non-commercial" group.
The material has been provided by InstaForex Company - www.instaforex.com