
To open long positions on EUR/USD, you need:
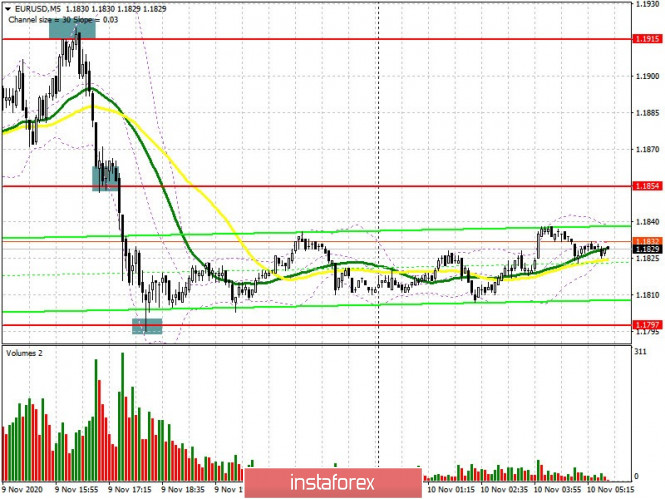
The situation was rather calm yesterday morning, and we did not see any signals to enter the market, but then the situation became completely different in the afternoon. Let's take a look at the 5-minute chart and break down the trades. An unsuccessful attempt to go beyond 1.1915 with a false breakout there, resulted in the euro being sold. I advised you to sell the euro in this scenario. A short pause at 1.1854 and its breakdown pulled down EUR/USD to a low of 1.1797, from where I recommended opening long positions immediately on a rebound. Unfortunately, we did not wait for an entry point into short positions from 1.185, because after the price went beyond this range, it reversed and this level was not tested.
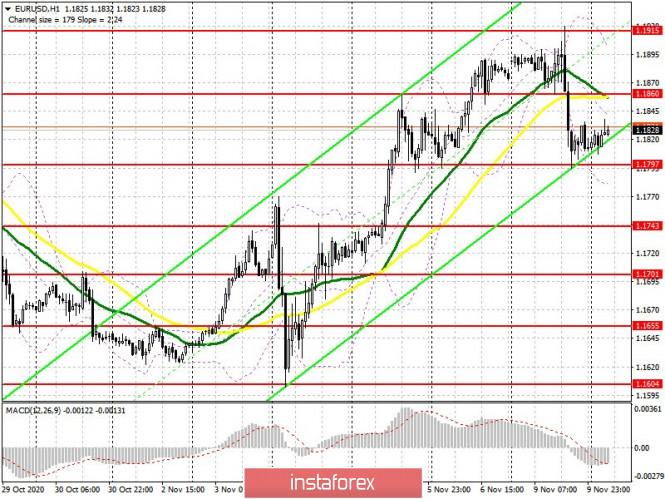
Buyers of the euro will also be focused on protecting the 1.1797 support, which was updated in yesterday's US session. It will be quite difficult for the bulls to do this, considering today's fundamental report on the economy of Germany and the eurozone. Therefore, forming a false breakout there will be a signal to open long positions in hopes to bring back the bullish trend that we saw last week. An equally important goal for the bulls is to go beyond and settle above the resistance of 1.1860, this is where the moving averages are, which are already playing on the side of the bears. Being able to settle in this range produces a signal for opening long positions, in hopes to recover to a high of 1.1915 and its update in the 1.1964 area, where I recommend taking profits. It is possible to sustain the downward correction if bulls are not active at the 1.1797 level. Therefore, in this scenario, I recommend opening new long positions, but only after support at 1.1743 has been updated, or for a rebound from the 1.1701 level, counting on a rebound of 15-20 points within the day.
To open short positions on EUR/USD, you need:
Sellers need to form a false breakout in the resistance area of 1.1860, which will be a signal to open short positions, in hopes to end the bull market and form a downward correction. This can be done if we receive weak data on the index of business activity in the euro area, which will be released in the first half of the day. The first target in such a scenario will be the low of 1.1797, which we failed to break through yesterday. However, you can only sell from this range and test this area from the bottom up. In this case, the price would fall towards 1.1743, and support at 1.1701 will be the next target for the middle of the week, which is where I recommend taking profits. If bears are not active at the resistance area of 1.1860, it is best to refrain from selling until yesterday's high at 1.1915 has been tested, or open short positions immediately on a rebound from the resistance at 1.1964, counting on a correction of 15-20 points within the day.
The Commitment of Traders (COT) report for November 3 recorded a reduction in long positions and an increase in short positions. Despite this, buyers of risky assets believe in the continuation of the bull market, although they prefer to proceed with caution. Thus, long non-commercial positions fell from 217,443 to 208,237, while short non-commercial positions rose from 61,888 to 67,888. The total non-commercial net position fell to 140,349, from 155,555 a week earlier. However, the bullish sentiment on the euro remains rather high in the medium term, especially after the victory of Joe Biden, who intends to endow the US economy with the next largest monetary aid package worth more than $2 trillion.
Indicator signals:
Moving averages
Trading is carried out below 30 and 50 moving averages, which indicates the likelihood of further downward correction of the euro.
Note: The period and prices of moving averages are considered by the author on the H1 chart and differs from the general definition of the classic daily moving averages on the D1 daily chart.
Bollinger Bands
In case of a decline, support will be provided by the lower border of the indicator at 1.1785. Growth will be limited by the upper level of the indicator around 1.1900.
Description of indicators
- Moving average (moving average, determines the current trend by smoothing out volatility and noise). Period 50. It is marked in yellow on the chart.
- Moving average (moving average, determines the current trend by smoothing out volatility and noise). Period 30. It is marked in green on the chart.
- MACD indicator (Moving Average Convergence/Divergence — convergence/divergence of moving averages) Quick EMA period 12. Slow EMA period to 26. SMA period 9
- Bollinger Bands (Bollinger Bands). Period 20
- Non-commercial speculative traders, such as individual traders, hedge funds, and large institutions that use the futures market for speculative purposes and meet certain requirements.
- Long non-commercial positions represent the total long open position of non-commercial traders.
- Short non-commercial positions represent the total short open position of non-commercial traders.
- Total non-commercial net position is the difference between short and long positions of non-commercial traders.