
EUR/USD 1H
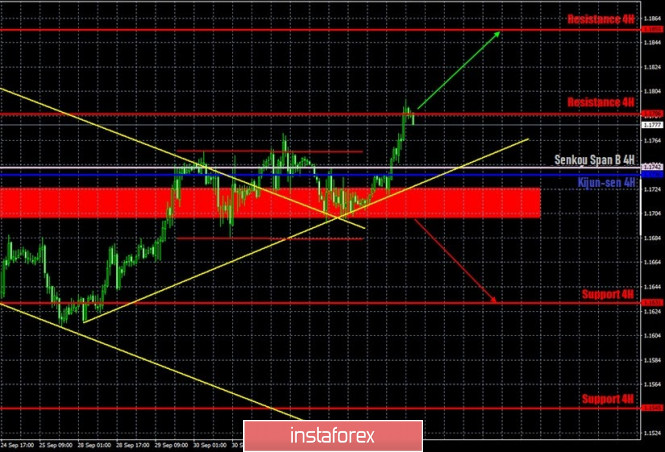
The euro/dollar pair, quite unexpectedly for many, resumed its upward movement on the hourly timeframe on October 5, after trading flat just a few days before. Nevertheless, the bulls found the strength to start buying the pair again, which caused the euro to grow. The first resistance level for this week has been reached, the ascending trend line, below which there was a consolidation prior, has been rebuilt and now provides support to the bull traders. Thus, the price broke out of the 1.1683-1.1756 area, in which there was a rare accumulation of various lines and resistances, which significantly increases the likelihood of forming an upward trend. Which, by the way, is much more likely from a fundamental point of view.
EUR/USD 15M
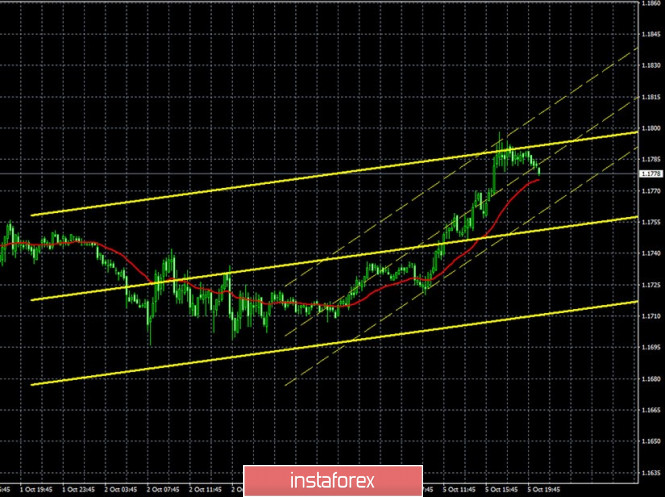
Both linear regression channels turned to the upside on the 15-minute timeframe, which clearly reflects the resumption of the upward trend on the higher timeframe. The euro/dollar rose in price by around 30 or 40 points during the last reporting week (September 23-29). We cannot even call it growth, just a normal market noise. The previous Commitment of Traders (COT) report showed that non-commercial traders opened 15,500 new Buy-contracts (longs) and almost 6,000 Sell-contracts (shorts). Thus, the net position for this group of traders increased by around 9,000. The new report clearly reflects what is currently happening in the foreign exchange market. Professional traders closed 4,500 contracts for buy positions on the euro and 3,300 contracts for sell positions during the reporting week. That is, the net position for the "non-commercial" group has decreased by around a thousand contracts, which means that the mood of large traders has become a little more bearish. However, these are not changes that can be acknowledged as global. Therefore, we conclude that the situation has not changed dramatically. The EUR/USD pair generally stood in one place for the next three trading days (after September 29). Therefore, the next COT report may also show minimal changes in the mood of professional traders.
The European Union published an index of business activity in the services sector for September. Despite the fact that its value remained below 50.0, the European currency was still rising in price against the dollar during the day. This means that this report was also ignored following much more important reports on inflation in the EU and NonFarm Payrolls in the US on Friday. Retail sales in the EU in August grew by 3.7% in annual terms and 4.4% in monthly terms. And take note that this report could have provoked the euro's growth, since it began approximately at the time of its release. As for the important ISM index of business activity in the US services sector, it rose even more in September and reached 57.8 points. However, the dollar did not strengthen in the afternoon. Thus, it turns out that traders have worked out the report on retail sales in the EU, but ignored the reports on business activity in the EU and the US. It is rather difficult to believe in such selectivity, so we conclude that all macroeconomic data were ignored on Monday.
We have two trading ideas for October 6:
1) Buyers have the initiative in the market once again and managed to get the pair out of the 1.1683-1.1756 horizontal channel. Thus, traders are encouraged to continue to trade upward with targets at the resistance levels of 1.1786 and 1.1855. A downward correction may begin now, since the first target was not overcome. But the upward trend persists above the trend line. Take Profit in this case will be up to 70 points.
2) Bears have finally released the market from their hands, but may return the downward trend if they manage to get the pair to settle below the upward trend line. In this case, we recommend opening new short positions with the target at 1.1631. In this case, the potential Take Profit is up to 80 points.
Explanations for illustrations:
Support and Resistance Levels are the levels that serve as targets when buying or selling the pair. You can place Take Profit near these levels.
Kijun-sen and Senkou Span B lines are lines of the Ichimoku indicator transferred to the hourly timeframe from the 4-hour one.
Support and resistance areas are areas from which the price has repeatedly rebounded off.
Yellow lines are trend lines, trend channels and any other technical patterns.
The material has been provided by InstaForex Company - www.instaforex.com