
To open long positions on GBP/USD, you need:
Yesterday was a rather difficult day for trading the British pound, as there were no clear signals to enter the market, except for the buy signal in the morning, which did not bring the expected result. If you look at the 5 minute chart, you can see how the bulls tried to regain resistance at 1.2965 in the afternoon, and seemed to be quite successful. Testing this area from top to bottom formed a comfortable entry point for long positions, but, unfortunately, the upward movement did not take place.
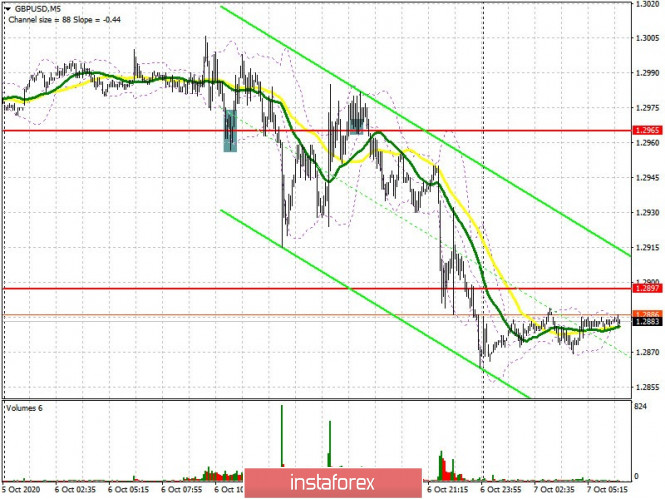
Now an important task for the pound buyers is to protect support at 1.2863, which was tested today in the Asian session. Forming a false breakout at this level will be a signal to open long positions while expecting the pound to recover to the resistance area of 1.2929, where the main struggle for the pair's succeeding direction will unfold. A breakout and settling above 1.2929 will indicate buyers' advantage and form an additional entry point into long positions with the main goal of renewing this week's high at 1.3001, where I recommend taking profits. If the bulls are not active in the support area of 1.2863, then it is best not to rush to buy, but to wait until a larger low at 1.2807 has been updated, where it is best to open long positions if a false breakout appears. You can act immediately on a rebound from the 1.2749 area counting on a correction of 30-40 points within the day.
The Commitment of Traders (COT) reports for September 29 recorded a sharp rise in short positions and a reduction in long positions, which affected the net position and led to its larger negative value. This once again confirms the desire of traders to build up short positions with any growth in the level, counting on uncertainty over Brexit and the prospects for the recovery of the British economy. The pressure on the pound will gradually increase as the second wave of coronavirus spreads. Short non-commercial positions increased from 40,523 to 51,961 during the reporting week. Long non-commercial positions decreased from 43,487 to 39,216. As a result, the non-commercial net position became negative and reached -12,745, against 2,964 a week earlier, which indicates that control over the market is gradually returning to large sellers.
To open short positions on GBP/USD, you need:
Sellers of the pound have a simple goal. To maintain control of the market. And in order to do this, they need to pull down GBP/USD below the 1.2863 level. Testing this area from the bottom-up forms a good entry point for short positions. In this case, the 1.2807 area is the nearest target, forming a breakout on it will increase pressure on the pound, which will open a direct road to the low of 1.2749, where I recommend taking profits. In case the pair grows in the first half of the day, it is best not to rush to sell, but to wait until resistance at 1.2929 has been updated, slightly above which is the area where the moving averages playing on the side of the bears also pass. You can sell the pound from this level immediately on the rebound. If bears are not active during the first test of this area, it is best to postpone short positions until the high of 1.3001 has been updated, counting on a correction of 30-40 points within the day.
Indicator signals:
Moving averages
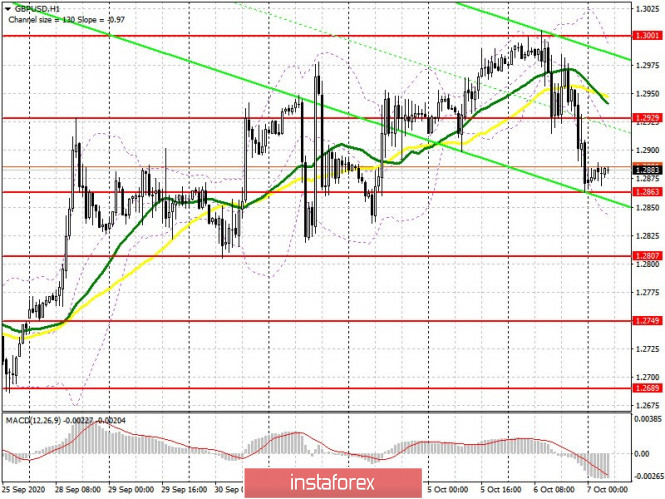
Trading is carried out below 30 and 50 moving averages, which implies that control over the market is returning to the bears' side.
Note: The period and prices of moving averages are considered by the author on the H1 hourly chart and differs from the general definition of the classic daily moving averages on the daily D1 chart.
Bollinger Bands
Growth will be limited by the upper level of the indicator in the 1.2970 area. A breakout of the lower border of the indicator in the 1.2840 area will increase the pressure on the pair.
Description of indicators
- Moving average (moving average, determines the current trend by smoothing out volatility and noise). Period 50. It is marked in yellow on the chart.
- Moving average (moving average, determines the current trend by smoothing out volatility and noise). Period 30. It is marked in green on the chart.
- MACD indicator (Moving Average Convergence/Divergence — convergence/divergence of moving averages) Quick EMA period 12. Slow EMA period to 26. SMA period 9
- Bollinger Bands (Bollinger Bands). Period 20
- Non-commercial speculative traders, such as individual traders, hedge funds, and large institutions that use the futures market for speculative purposes and meet certain requirements.
- Long non-commercial positions represent the total long open position of non-commercial traders.
- Short non-commercial positions represent the total short open position of non-commercial traders.
- Total non-commercial net position is the difference between short and long positions of non-commercial traders.