
To open long positions on GBP/USD, you need:
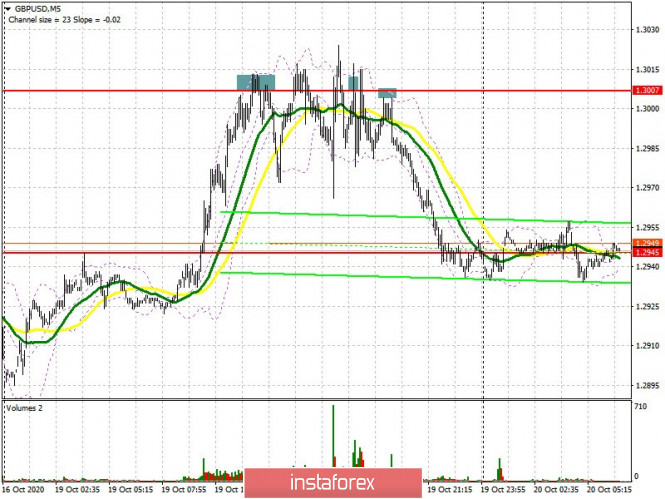
Yesterday's bullish momentum did not receive support in the afternoon, as expected, since buyers of the pound have very little reason for optimism. If you look at the 5-minute chart, you will see how the signal for selling GBP/USD, which I analyzed in detail in yesterday's afternoon review, and where I also recommended opening short positions, was confirmed several more times. Another false breakout of the 1.3007 level occurred at the beginning and middle of the US session, which only increased pressure on the pound and caused it to fall to the support area of 1.2945. As a result, the profit reached more than 50 points.
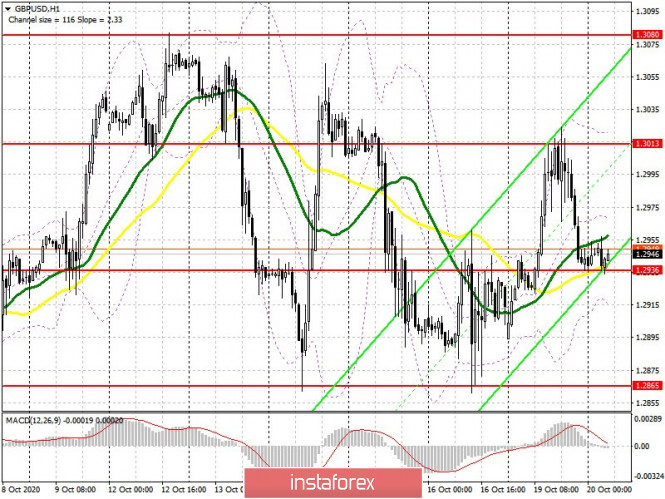
From a technical point of view, nothing has changed much at the moment, since the pair did not go beyond the horizontal channel. However, buyers are no longer fighting for 1.3013, but defending 1.2936 instead. On the hourly chart, you can see how trading is now being carried out in the 1.2936 area and the bulls will have to put in a lot of effort to achieve a false breakout at this level, which will be a signal to open long positions in the pair. In this case, the goal is to return to the upper border of the horizontal channel at 1.3013, which also serves as yesterday's high. Forming a breakout on it will resume the bull market and open a direct path to the 1.3080 area, where I recommend taking profits. In the absence of activity at the 1.2936 level during the first half of the day, it is best not to rush into buy positions, since important fundamental statistics will not be published today, and there is no particular reason for the pound to rise. The closest support level will be the lower border of the horizontal channel at 1.2865, from which you can buy the pound immediately on a rebound, counting on a correction of 20-30 points within the day.
The Commitment of Traders (COT) reports for October 13 showed that both long and short non-commercial positions have decreased. Long non-commercial positions declined from 40,698 to 36,195. At the same time, short non-commercial positions significantly dropped from 51,996 to 45,997. As a result, the negative value of the non-commercial net position slightly increased to -9 802 , against -11,298 a week earlier, which indicates that sellers of the British pound retain control and also shows their slight advantage in the current situation.
To open short positions on GBP/USD, you need:
Sellers clearly do not intend to give up the market and they will focus on support at 1.2936 in the morning. Settling below this range forms a good entry point for short positions in anticipation of returning the pound to the lower border of the horizontal channel at 1.2865, where I recommend taking profits. Going beyond it will lead to forming a bearish trend that can pull down the pound to the lows of 1.2807 and 1.2749. If the bulls manage to seize the initiative, then it is better not to rush to sell. The most optimal scenario for opening short positions will be forming a false breakout in the area of the upper border of the horizontal channel at 1.3013. I recommend selling GBP/USD immediately on a rebound after testing a new high of 1.3080, counting on a correction of 20-30 points within the day.
Indicator signals:
Moving averages
Trading is carried out in the area of 30 and 50 moving averages, which indicates another market uncertainty with direction.
Note: The period and prices of moving averages are considered by the author on the H1 hourly chart and differs from the general definition of the classic daily moving averages on the daily D1 chart.
Bollinger Bands
Growth will be limited by the upper level of the indicator around 1.3013. A breakout of the lower border of the indicator in the 1.2920 area will increase the pressure on the pair.
Description of indicators
- Moving average (moving average, determines the current trend by smoothing out volatility and noise). Period 50. It is marked in yellow on the chart.
- Moving average (moving average, determines the current trend by smoothing out volatility and noise). Period 30. It is marked in green on the chart.
- MACD indicator (Moving Average Convergence/Divergence — convergence/divergence of moving averages) Quick EMA period 12. Slow EMA period to 26. SMA period 9
- Bollinger Bands (Bollinger Bands). Period 20
- Non-commercial speculative traders, such as individual traders, hedge funds, and large institutions that use the futures market for speculative purposes and meet certain requirements.
- Long non-commercial positions represent the total long open position of non-commercial traders.
- Short non-commercial positions represent the total short open position of non-commercial traders.
- Total non-commercial net position is the difference between short and long positions of non-commercial traders.