
To open long positions on EUR/USD, you need:
Buyers of the euro did not try to sustain the upward trend in the afternoon, nothing came of it. Let's take a look at the 5-minute chart and break down yesterday's trades. Bulls failed to go beyond 1.1868 during the first half of the day, which led to forming a false breakout and a signal to sell the euro. However, this did not lead to a large sale, as a result of which, the bulls took resistance at 1.1868 in the afternoon and formed a good entry point for long positions, however, a powerful upward moment did not occur, which resulted in extinguishing hopes for further growth.
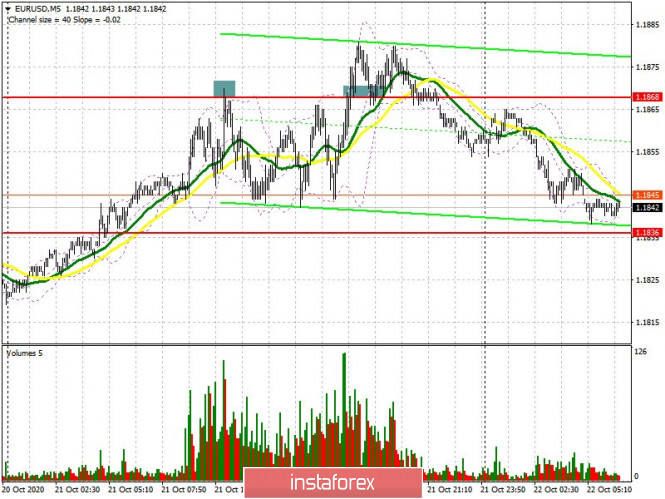
At the moment, the bulls need to think about how they can protect support at 1.1836. Forming a false breakout at this level in the first half of the day will be a signal to open long positions in euros during the weekly bullish trend. The primary goal is to return to resistance at 1.1875. Forming a breakout on this range and settling on it, similar to yesterday, will serve as a new signal for you to open long positions in order to test the highs of 1.1915 and 1.1964, where I recommend taking profits. In case bulls are not active at 1.1836 in the first half of the day, and since we do not have important fundamental reports today, we can expect a downward correction in EUR/USD, down to the area of a large support at 1.1802, where you can consider buy positions on the euro. I recommend opening long positions immediately on a rebound, but only from a low of 1.1765, counting on a correction of 15-20 points within the day.
The Commitment of Traders (COT) report for October 13 showed a decrease in long positions and an increase in short ones, which led to an even greater decline in the delta. Despite this, buyers of risky assets believe that the bull market will continue, but they prefer to act with caution, as there is no good news for the eurozone yet. Thus, long non-commercial positions decreased from 231,369 to 228,295, while short non-commercial positions increased from 57,061 to 59,658. The total non-commercial net position decreased to 168,637, against 174,308 a week earlier. which indicates a wait-and-see attitude from new players, however, bullish sentiments for the euro remain rather high in the medium term. The more the euro will decline against the US dollar at the end of this year, the more attractive it will be for new investors.
To open short positions on EUR/USD, you need:
In order for sellers to be able to take control of the market and continue the downward correction, it is necessary to settle below support at 1.1836, testing it on the reverse side forms a good signal to sell the euro, in hopes to update of the low of 1.1802, where I recommend taking profit. The next target is support at 1.1765. If EUR/USD increases in the first half of the day, then it is best not to rush to sell, but to wait until a false breakout forms in the resistance area of 1.1875. You can open short positions immediately on a rebound from the high of 1.1915, counting on a correction of 15-20 points within the day.
Indicator signals:
Moving averages
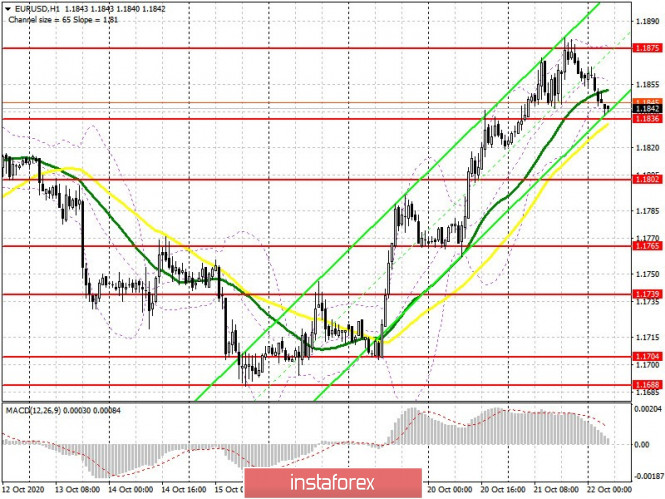
Trading is carried out in the area of 30 and 50 moving averages, which indicates uncertainty regarding the direction and that the bullish momentum is fading.
Note: The period and prices of moving averages are considered by the author on the H1 hourly chart and differs from the general definition of classic daily moving averages on the D1 daily chart.
Bollinger Bands
A breakout of the upper border of the indicator in the 1.1875 area will lead to an increase in EUR/USD. A breakout of the lower border of the indicator in the 1.1836 area will increase pressure on the pair.
Description of indicators
- Moving average (moving average, determines the current trend by smoothing out volatility and noise). Period 50. It is marked in yellow on the chart.
- Moving average (moving average, determines the current trend by smoothing out volatility and noise). Period 30. It is marked in green on the chart.
- MACD indicator (Moving Average Convergence/Divergence — convergence/divergence of moving averages) Quick EMA period 12. Slow EMA period to 26. SMA period 9
- Bollinger Bands (Bollinger Bands). Period 20
- Non-commercial speculative traders, such as individual traders, hedge funds, and large institutions that use the futures market for speculative purposes and meet certain requirements.
- Long non-commercial positions represent the total long open position of non-commercial traders.
- Short non-commercial positions represent the total short open position of non-commercial traders.
- Total non-commercial net position is the difference between short and long positions of non-commercial traders.