
To open long positions on EUR/USD, you need:
Several signals to sell the euro appeared yesterday. The bulls' failure to climb to the 1.1754 level formed a good entry point into short positions for the euro in the afternoon. And today, the bears achieved their goal and tested the key target of 1.1713 during the Asian session, which made it possible to take around 40 points of profit from the market. We see that the bulls tried to gain a foothold above 1.1745 in the afternoon, but the reverse test of this level from top to bottom led to an instant breakout, so the necessary entry point for long deals was not formed.
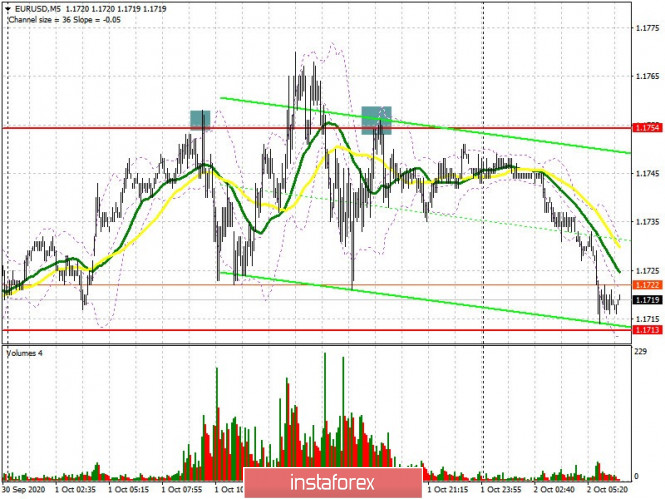
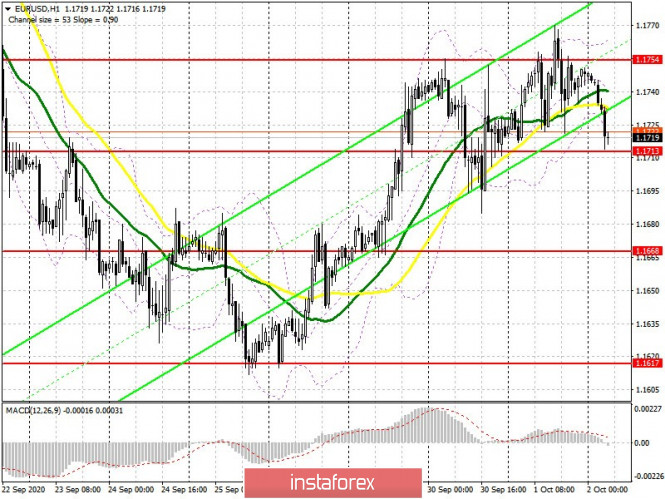
Nothing has changed since yesterday from a technical point of view. Euro buyers have the main task of breaking through and settling above the resistance of 1.1754, which will lead to a new wave of EUR/USD growth in the high of 1.1796. The 1.1833 level will be a distant target, which is where I recommend taking profits. However, before that it is worth trying to protect the nearest support level of 1.1713, where forming a false breakout will serve as a reason to open long positions in the pair. This area also coincides with the lower border of the corrective channel that was formed on September 28th. Therefore, it is best not to rush to buy when we have gone beyond this area, but to wait until the low of 1.1668 has been updated and open long positions there for a rebound, counting on a correction of 20-30 points within the day. We expect the eurozone inflation report to be released in the first half of the day, which may turn out to be worse than economists' forecasts, which is not in favor of the euro. And we also have a strong report on the number of employed in the US nonfarm sector in the afternoon, which can move the pair in any direction.
The Commitment of Traders (COT) reports for September 22 showed that both long and short positions increased, but there were more of the first ones than the latter, which led to an increase in the delta. Apparently, buyers are attracted to such a low euro rate for the first time in three months, even despite the risk of a second wave of coronavirus infection across Europe. Thus, long non-commercial positions increased from 230,695 to 247,049, while short non-commercial positions only increased from 52,199 to the level of 56,227. The total non-commercial net position also increased over the reporting week to 190,822, against 178,576 a week earlier, which indicates bullish market sentiment in the medium term. The more the euro falls against the US dollar, the more attractive it will be for new investors.
To open short positions on EUR/USD, you need:
Sellers of the euro need to defend resistance at 1.1754, and form a false breakout on it, similar to yesterday. This will be your signal to open short positions in the pair. Now the bears are mainly aiming for a low of 1.1713, consolidation below which forms an additional entry point to short positions and will return the market to the bears, allowing them to reach the 1.1668 area, where I recommend taking profits. Support at 1.1617 will be a distant target. If the inflation data turns out to be better than forecasts, and there is no serious activity when resistance is tested at 1.1754, then it is best not to rush to sell, but to wait until the quote rises to a new resistance at 1.1796 and then you can sell the euro there immediately on a rebound, counting on a correction of 20-30 points within the day.
Indicator signals:
Moving averages
Trading is carried out just below 30 and 50 moving averages, which indicates the bears' attempt to regain control of the market.
Note: The period and prices of moving averages are considered by the author on the H1 hourly chart and differs from the general definition of the classic daily moving averages on the D1 daily chart.
Bollinger Bands
The breakout of the upper border of the indicator around 1.1765 will help the euro grow further. A break of the lower border at 1.1715 will increase pressure on the euro.
Description of indicators
- Moving average (moving average, determines the current trend by smoothing out volatility and noise). Period 50. It is marked in yellow on the chart.
- Moving average (moving average, determines the current trend by smoothing out volatility and noise). Period 30. It is marked in green on the chart.
- MACD indicator (Moving Average Convergence/Divergence — convergence/divergence of moving averages) Quick EMA period 12. Slow EMA period to 26. SMA period 9
- Bollinger Bands (Bollinger Bands). Period 20
- Non-commercial speculative traders, such as individual traders, hedge funds, and large institutions that use the futures market for speculative purposes and meet certain requirements.
- Long non-commercial positions represent the total long open position of non-commercial traders.
- Short non-commercial positions represent the total short open position of non-commercial traders.
- Total non-commercial net position is the difference between short and long positions of non-commercial traders.