
To open long positions in GBP/USD, you need:
If we had problems with selling the British pound in the morning, then the signals to which I mentioned in the afternoon made it possible for us to take a piece of profit from the market. Let's take a look at the 5-minute chart and see where you could enter the market. Recall that in yesterday's forecast, I drew attention to selling the pound after a breakout of the 1.2867 level and testing it from the bottom up, which happened. But, even if you did not have time to enter when this range was initially updated, you could have taken advantage of this chance a second time, which led to a sharper fall towards the low of 1.2777, where I recommended buying the pound immediately on the rebound, and also enabled us to catch around 40 points from the market.
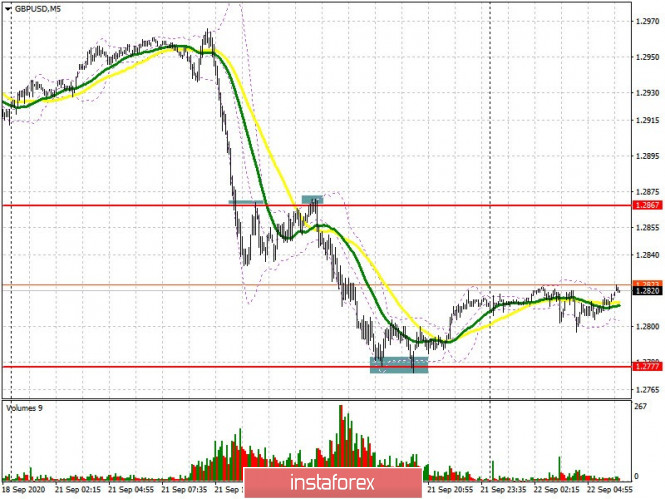
Bulls need to regain resistance at 1.2867 at the moment, since this will reduce the pressure on the pound. Consolidating above this range, where the moving averages, playing on the side of sellers, are also forming a signal to buy GBP/USD with the main goal of rising towards yesterday's resistance at 1.2962, which is where I recommend taking profits. If the pound is still under pressure, and most likely it will be, buyers will need a lot of strength to protect support at 1.2777. Forming a false breakout there, along with confirming the divergence on the MACD indicator, produces a signal to buy the pound. If no one is active, I recommend postponing long positions until the new lows of 1.2725 and 1.2675 are updated and then you can think about long positions, counting on a correction of 30-40 points within the day.
Let me remind you that the Commitment of Traders (COT) reports for September 15 showed a reduction in long positions and a large increase in short positions, which indicates market expectations and a high possibility that the pound will fall in the long term, which may be due to uncertainty regarding the conclusion of the Brexit trade deal. And if last week, it was possible to say that the downward momentum may start to gradually slow down, which the market showed us, now the situation is on the side of the pound sellers once again and the pair may succeedingly fall. Short non-commercial positions increased from 33,860 to 41,508 during the reporting week. Long non-commercial positions fell from 46,590 to 43,801. As a result, the non-commercial net position sharply fell to 2,293, against 12,730, a week earlier.
To open short positions on GBP/USD, you need:
Today, we have the Governor of the Bank of England, Andrew Bailey. His statements may put pressure on the British pound. Therefore, a breakout and settling in the area below support at 1.2777 forms a good signal to sell the pound. However, it is worth paying attention to the divergence on the MACD indicator. In case GBP/USD does not quickly move after settling below the 1.2777 level, it is best to slow down with short positions at the lows and wait for an upward correction in the pair. New areas 1.2725 and 1.2675 will be the bears' main target, which is where I recommend taking profits. If GBP/USD rises in the first half of the day, and this scenario is more acceptable for opening short positions, it is best to wait until resistance is updated at 1.2867 and sell the pound there immediately on a rebound, expecting the resumption of the bear market. The moving averages, which pass slightly above this range, will also come to the rescue. In case bears are not active at 1.2867, it is best to refuse to sell until the 1.2962 high is updated while aiming for a downward correction of 30-40 points within the day.
Indicator signals:
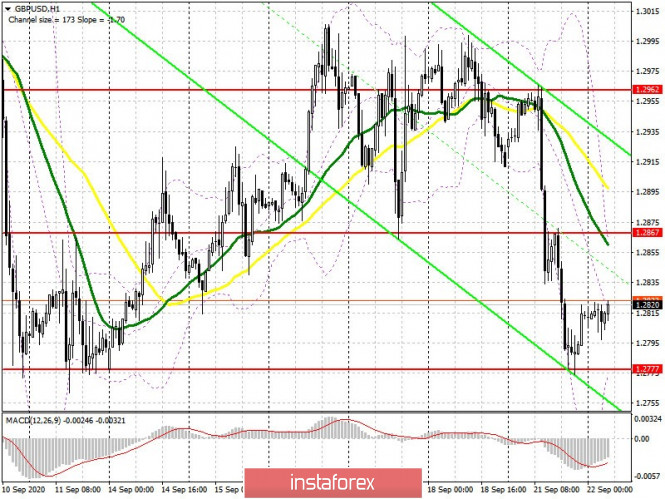
Moving averages
Trading is underway below 30 and 50 moving averages, indicating a renewed bearish trend.
Note: The period and prices of moving averages are considered by the author on the H1 hourly chart and differs from the general definition of the classic daily moving averages on the daily D1 chart.
Bollinger Bands
A breakout of the lower boundary of the indicator in the 1.2777 area will lead to a new wave of decline for the pound. A breakout of the upper border of the indicator in the 1.2867 area will cause the pair to rise.
Description of indicators
- Moving average (moving average, determines the current trend by smoothing out volatility and noise). Period 50. It is marked in yellow on the chart.
- Moving average (moving average, determines the current trend by smoothing out volatility and noise). Period 30. It is marked in green on the chart.
- MACD indicator (Moving Average Convergence/Divergence — convergence/divergence of moving averages) Quick EMA period 12. Slow EMA period to 26. SMA period 9
- Bollinger Bands (Bollinger Bands). Period 20
- Non-commercial speculative traders, such as individual traders, hedge funds, and large institutions that use the futures market for speculative purposes and meet certain requirements.
- Long non-commercial positions represent the total long open position of non-commercial traders.
- Short non-commercial positions represent the total short open position of non-commercial traders.
- Total non-commercial net position is the difference between short and long positions of non-commercial traders.