
Trend analysis (Fig. 1).
The market may move downward from the level of 1.3153 (closing of yesterday's daily candle) with the target at the 21 average EMA at 1.3051 (black thin line). In case of testing this level, the downward trend may continue with the next target of 1.3027 - a 23.6% pullback level (red dotted line).
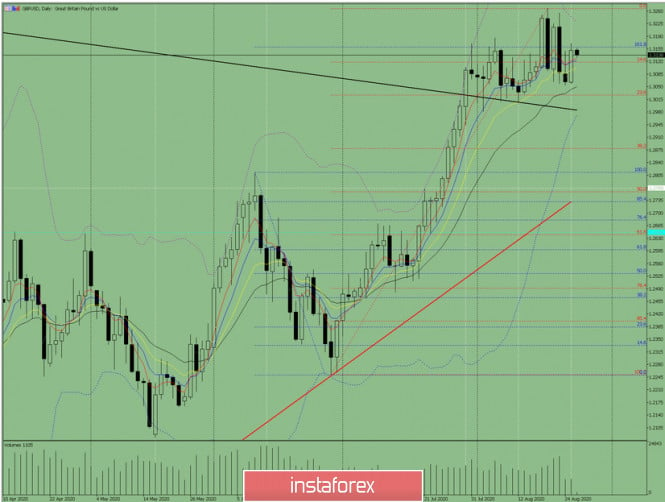
Figure: 1 (daily chart).
Comprehensive analysis:
- Indicator analysis - down;
- Fibonacci levels - down;
- Volumes - down;
- Candlestick analysis - neutral;
- Trend analysis - up;
- Bollinger lines - up;
- Weekly chart - up.
General conclusion:
Today, the price may begin to move downward from the level of 1.3151 (closing of yesterday's daily candlestick) with the target at the 21 average EMA at 1.3051 (black thin line). In case of testing this level, the downward trend may continue with the next target of 1.3027 - a 23.6% pullback level (red dotted line).
Another possible scenario is, from the level of 1.3240 (closing of yesterday's daily candle), the price may begin to move downward with the target at 1.3118 - a 14.6% pullback level (red dashed line). From this level, the price may begin to move upwards with the target at the upper fractal 1.3267 (red dotted line ).
The material has been provided by InstaForex Company - www.instaforex.com