
EUR/USD 1H
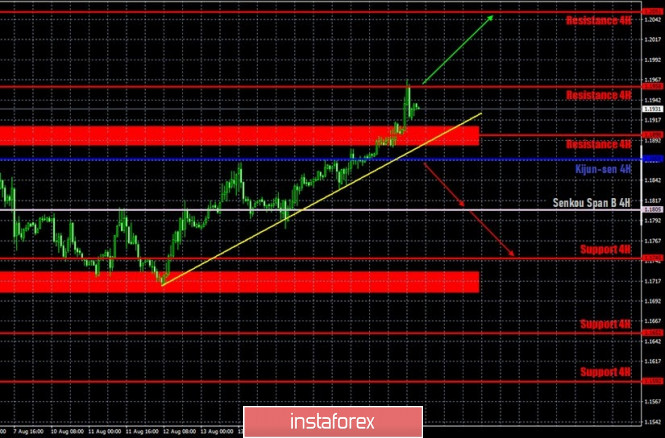
The euro/dollar pair continued its upward movement on the hourly timeframe of August 18, breaking the resistance area of 1.1886-1.1910, which allowed buyers to continue to put pressure on the pair. Thus, the quotes reached the resistance level of 1.1958 by the end of the trading day, which is the second target this week. But most importantly, now we can say that the price has left the side channel, which means that the upward trend has resumed. At the same time, we remind traders that the price has not been able to adjust properly for the past three weeks, so the dollar remains firmly oversold. This means that the upward trend can end at any time. However, we still have an upward trend line at our disposal, which greatly helps in determining the current trend.
EUR/USD 15M
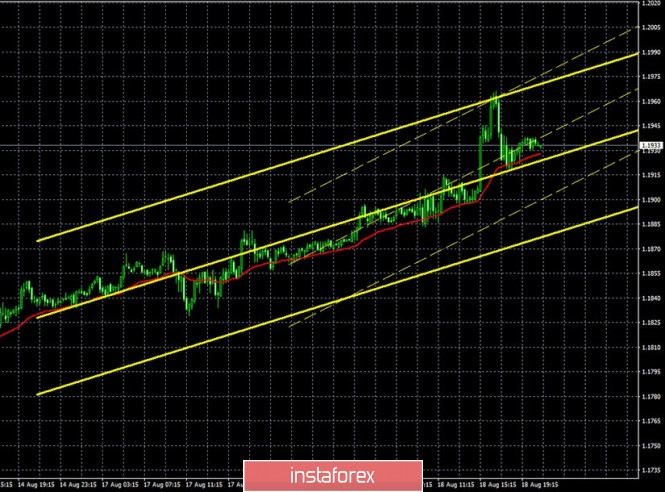
Both channels of linear regression are still directed upwards on the 15-minute timeframe, since the mood of traders at the beginning of the new week has not changed. Last Friday, a new Commitments of Traders (COT) report was released. According to this report, non-commercial traders reopened Buy-contracts and closed Sell-deals. Thus, the net position for the "non-commercial" category of traders, which is the most important and category of traders, has grown again, this time by 15,000 contracts, which is a high value (5,128 Buy-contracts were opened and 9,681 Sell-contracts were closed). Hence, the conclusion is that the mood of large traders has not changed at all over the past week. In principle, the same conclusion can be drawn by looking at the chart of the euro/dollar currency pair itself. The pair has been in the side channel since July 27, that is, for three weeks, after which the upward movement resumed. During all this time, traders managed to adjust the pair by a maximum of 200 points down, which is very little to be reflected in the COT report. At the same time, the euro continues to rise in price, and COT reports are likely to continue to show an increase in bullish sentiment.
The fundamental background for the EUR/USD pair was extremely weak on Tuesday. No important macroeconomic reports were published that day, however, the dollar resumed to sharply fall for no apparent reason. However, the overall fundamental situation in America remains such that the next fall in the US dollar is not surprising. Traders will focus their attention on inflation in the European Union on Wednesday, the forecast for which is very low. Thus, it will not be difficult to surpass it, given the recovery of the European economy. At the same time, the euro has already risen in price quite strongly and at least a slight correction is needed. Thus, we believe that tomorrow, in almost any case, a correction to the trend line will begin, which the price may even try to overcome. Markets participants are unlikely to take note of tonight's release of the Fed minutes.
Based on the above, we have two trading ideas for August 19:
1) Buyers stepped up their trading on Tuesday and again took the initiative into their own hands. The pair has reached the 1.1958 level, so we recommend buying the euro again while aiming for 1.2051 if traders overcome the target. In this case, the potential Take Profit will be about 80 points.
2) Bears could not go below the 1.1715 level, and now they still have to overcome the trend line in order to count on at least a small drop in the pair. We recommend opening sales after overcoming the support area of 1.1886-1.1910 and the upward trend line with the first target, the Senkou Span B line (1.1805). In this case, the potential Take Profit will be about 50 points.
We recommend that you also explore the fundamental background in these articles:
Overview of the EUR/USD pair. August 19. "Neither fish nor fowl". Americans are going to vote for Biden not because he is good, but because Trump is bad.
Review of the GBP/USD pair. August 19. The US and China are in conflict again, this time over Huawei. The dollar falls back into the abyss and remains extremely oversold.
Explanations for illustrations:
Support and Resistance Levels are the levels that serve as targets when buying or selling the pair. You can place Take Profit near these levels.
Kijun-sen and Senkou Span B lines are lines of the Ichimoku indicator transferred to the hourly timeframe from the 4-hour one.
Support and resistance areas are areas from which the price has repeatedly rebounded off.
Yellow lines are trend lines, trend channels and any other technical patterns.
The material has been provided by InstaForex Company - www.instaforex.com