
To open long positions on GBP/USD, you need to:
Friday's data on the growth of income and spending of Americans led to a small downward correction of the bullish trend, which formed several good signals to buy the pound in anticipation of continuing growth, which happened. Let's look at the 5-minute chart and analyze the trades. We can see that after settling above the resistance of 1.3271, testing this level from top to bottom had formed a good entry point, which led to the pair's growth in the resistance area of 1.3324, where I recommended selling immediately for a rebound. However, before the initial test of the 1.3324 level, there were literally 4 points missing, so those who missed this sale against the trend did the right thing. After the pound returned and a breakout formed at the 1.3324 level, and it was also tested from top to bottom by the end of the US session, a good buy signal had formed, which brought about another 40 points of profit. At the moment, the task of the bulls is to protect the support of 1.3324. Forming a false breakout at this level, along with a rebound from the moving averages, will be a good signal to open long positions in continuing the upward trend. An equally important task for the bulls is to settle above the resistance of 1.3386, which will only strengthen the bullish momentum and lead to the renewal of the next high in the area of 1.3437 and 1.3467, where I recommend taking profits. In case the pound falls and buyers are not active in the area of 1.3324, it is best to postpone purchases until a larger low of 1.3271 has been tested and open long positions from there immediately to rebound in anticipation of a correction of 20-30 points within the day.

To open short positions on GBP/USD, you need to:
The bears need to try to prevent a breakout of the 1.3386 resistance, which is so clearly aimed at the buyers of the pound. Unsuccessfully settling above this range and returning to the area under it forms a good entry point for selling the pound in the morning, in anticipation of returning and falling to the support of 1.3324, where the downward movement may slow down. Settling below this range will form a more powerful bearish wave, capable of returning the pair to the 1.3271 area, where I recommend taking profits. In case sellers are not active at the 1.3386 level, it is best to postpone short positions until the next major resistance is updated in the area of 1.33371, or sell GBP/USD immediately for a rebound from the new major level of 1.3467 in anticipation of a correction of 20-30 points within the day.
Indicator signals:
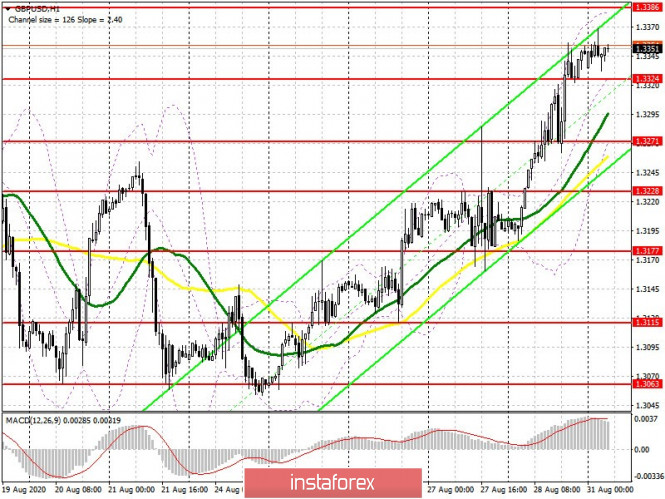
Moving averages
Trading is carried out above 30 and 50 moving averages, which indicates a continuation of the upward trend for the pound.
Note: The period and prices of moving averages are considered by the author on the H1 hourly chart and differs from the general definition of the classic daily moving averages on the D1 daily chart.
Bollinger Bands
A breakout of the upper border of the indicator around 1.3385 will lead to a new wave of growth in the pound. In case of a decline in the pair, support will be provided by the lower border of the indicator in the area of 1.3271.
Description of indicators
- Moving average (moving average, determines the current trend by smoothing out volatility and noise). Period 50. It is marked in yellow on the chart.
- Moving average (moving average, determines the current trend by smoothing out volatility and noise). Period 30. It is marked in green on the chart.
- MACD indicator (Moving Average Convergence/Divergence — convergence/divergence of moving averages) Fast EMA period 12. Slow EMA period to 26. SMA period 9
- Bollinger Bands (Bollinger Bands). Period 20
- Non-commercial speculative traders, such as individual traders, hedge funds, and large institutions that use the futures market for speculative purposes and meet certain requirements.
- Long non-commercial positions represent the total long open position of non-commercial traders.
- Short non-commercial positions represent the total short open position of non-commercial traders.
- Total non-commercial net position is the difference between the short and long positions of non-commercial traders.