
Trend analysis.
The price, from the level of 1.2478 (closing of the last weekly candle), is expected to rise this week, with the goal of reaching a pullback level of 61.8% - 1.2597 (red dotted line). If this level is reached, we can continue to work upwards with the target of 1.2703 - resistance line (red bold line). From this line, a downward movement is possible.
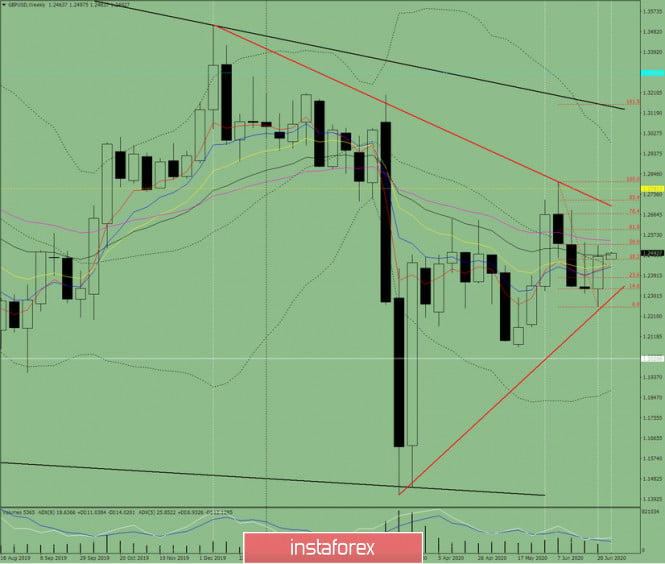
Fig. 1 (weekly schedule).
Comprehensive analysis:
- indicator analysis - up;
- Fibonacci levels - up;
- volumes - up;
- candlestick analysis - up;
- trend analysis - up;
- Bollinger Bands - neutral;
- monthly chart - up.
The conclusion of a comprehensive analysis is an upward movement.
The overall result of calculating the candle of the GBP/USD currency pair according to the weekly chart: the price for the week will most likely have an upward trend with the absence of the first lower shadow of the weekly white candlestick (Monday - up) and the absence of the second upper shadow (Friday - up).
The first upper goal is to reach the pullback level of 61.8% - 1.2597 (red dashed line). If this level is reached, continue to work upwards with the target 1.2703 - resistance line (red bold line).
An unlikely but possible scenario: when moving up and reaching a pullback level of 50% - 1.2530 (red dashed line), the price will decline, so that the lower fractal - 1.2250 (red dashed line) will be reached.
The material has been provided by InstaForex Company - www.instaforex.com