
Hi dear colleagues!
The market has recovered after a shock slump in oil prices in early March. Afterwards, OPEC and its allies agreed on some oil output cuts that somehow revived oil prices. Investors and speculators also added to a notable advance of crude oil. Nevertheless, in the recent few weeks, the benchmark oil grades have been consolidating at about major resistance. So, traders are wondering whether the oil market has prospects of a further bullish trend or a trend reversal. I don't mean to have the last word on this, but let me consider a few scenarios in the context of the current fundamentals and the technical picture of the oil market.Last week, the meeting of the OPEC+ technical committee ended with the decision to ease output cuts to 8.2 million barrels per day from August. The cartel is worried about uncertain prospects for oil demand which will hardly recover to the levels of 2019 in the nearest few years.
A week ago, the US Energy Information Administration released a short-term outlook for oil prices and oil consumption for this year and 2021. From the viewpoint of American analysts, Brent crude could be trading at $41/barrel in the 2nd half of 2020 and $50/barrel in 2021. The US Energy Department expects an annual average crude output in the US to contract because spot West Texas Intermediate (WTI) is set to remain below $50/barrel until the end of 2021. Besides, the EIA predicts that crude output in the US will equal 11.6 million barrels per day on average in 2020 and 11.0 million bpd in 2021. Both figures will be lower than an average daily output in 2019 that was 12.2 million barrels.
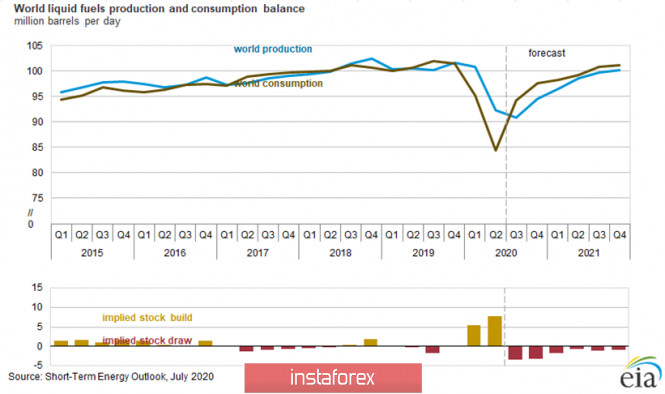
After a crater in the oil market in Q2 2020, global oil consumption is likely to expand to 96 million barrels per day in the 2nd half of the year that will be 5 million barrels lower than a consumption rate in 2019 when an average consumption was measured at 101 bpd. At the same time, oil production cuts imposed by the OPEC+ pact could entail a shortage of almost 3 million barrels worldwide in the 3d and 4th quarters this year (picture 1).
Picture 1. Demand and supply balance in global oil market in 2020/21
At present, the major goal set by OPEC is to reduce commercial oil inventories which are still huge enough, surpassing a 5-year average value in developed countries by 10-12 million barrels. The domestic oil consumption in Russia will amount to 3.9 million barrels in the 2nd half this year that is higher than consumption rates in 2019. On the other hand, oil production in Russia is expected to contract up to 10 million barrels that is 1.5 million barrels lower than in 2019.
Another catalyst for a further uptrend of in the oil market is extremely long positions of speculators on NYMEX-CME. According to the Commitment of Traders Report (COT) from 03/07/2020, the volume of long positions is 420.000 contracts that is a two-year high.
Oil prices find support from the events in Libya. Influential tribes entered into agreement with Marshal Khalifa Haftar who is the commander of the Libyan National Army (LNA). They barred crude supplies to international markets. Amid such disruptions, oil production in Libya shrank to virtually zero from 1.5 million barrels in December 2019. The long-standing conflict between the Libyan National Army backed by a broad coalition of Egypt, Saudi Arabia, France, and Russia on the one hand and the UN-recognized Government of National Accord (PNS) backed by Turkey on the the hand is still going on. The fierce standoff crippled oil production in Libya. These are all factors supporting oil prices at the current relatively high levels.
Now let's reckon bearish factors. Earlier, I mentioned the COT report. Oddly enough, numerous long speculative positions sharply contrast with a steep decline of open interest which is seen as a barometer of supply and demand. The open interest indicator has sunk to the lowest level since the autumn 2019. Notably, the open interest level dropped to 2.6 million contracts from 3.4 million contracts in the period from April to July this year that is almost a quarter.
Besides, there are other bearish factors for oil such as bleak prospects of the global economy, a surge of COVID-19 in India, the resurgence of infection in the US, and a slump in oil consumption in Europe. This bunch of factors is to blame for low demand. It is common knowledge that the US is the top consumer of oil and petroleum products. When it comes to India, it consumes not so much oil despite being the third world's largest economy. It consumes slightly more oil than Russia.
The forecast of average daily oil consumption in India comes out at mere 4.45 million barrels per day this year. Demand in the EU is also set to decline by 1.5 million barrels to 13.3 bpd on the back of the pandemic. Analysts expect demand in the EU to rebound marginally in the 2nd half of 2020 to 13.7 million on condition that the second coronavirus wave does not hit Europe.
In addition to other headwinds for the oil market, autumn storms frequently strike the Mexican Gulf where there is a cluster of oil processing plants in the US. The thing is that August WTI contracts are trading now on American exchange floors. These futures will be followed by September contracts. Exactly in September, tropical storms hit the Mexican Gulf, thus suspending oil processing. As a result, too much oil is amassed in storage facilities which have been already piled up to the full.
So, I've painted the fundamental picture. In this context, let's consider the technical picture of the two benchmark oil grades: #XBZ and WTI #CL (pictures 2 and 3). Let's try to figure out a trading strategy for the nearest 1-2 weeks.
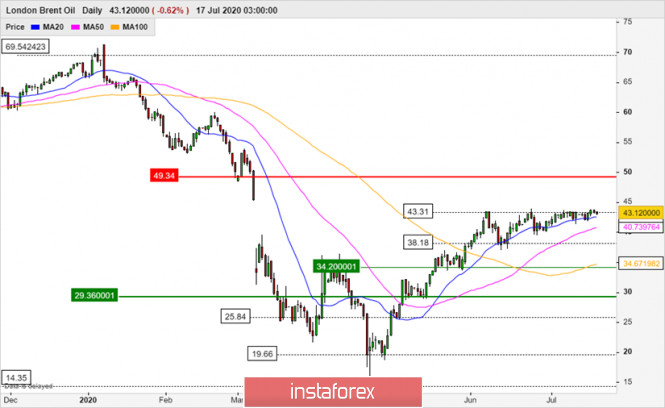
Picture 2. Technical picture of #XBZ (Brent)
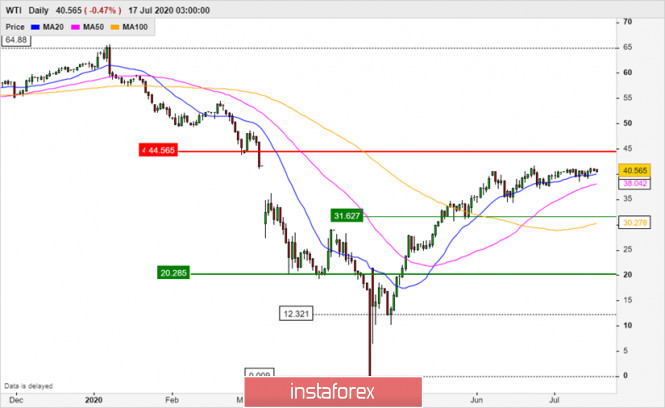
Picture 3: Technical picture of WTI #CL
Based on charts 2 and 3, both grades have approached resistance levels of $43 for Brent and $41 for WTI. I'm almost 100% sure that a lot of traders have already opened short deals amid such bearish prospects. Nevertheless, the fundamental picture and technical charts are sending a message that oil has not exhausted its momentum yet. I mean that both grades have higher resistance levels at $49.34 for Brent and $45.56 for WTI. These levels can serve as upward targets. In other words, technical analysis, our prime tool, suggests exactly the bullish scenario. Yes, I foresee a further uptrend but not a downtrend.
The bearish scenario could resurface not earlier than the price slips below the 50-period moving average which is currently located at $40.75 for Brent and $38.05 for WTI. The downward targets for Brent #XBZ could be set at $38.18, $34.30, and $29.36. The downward targets for WTI #CL could coincide with the support levels of $31.63 and $20.29. Be sensible and careful! Make sure you follow the money management rules!
The material has been provided by InstaForex Company - www.instaforex.com