
EUR/USD
Yesterday, the euro continued to work out positive economic statistics; on Tuesday it was the release of a strong eurozone business sentiment index for May from the ZEW institute - an increase from 25.2 to 46.0, on Wednesday the consumer confidence index also showed an increase from -23 to -19 in May. The eurozone balance of payments also came out yesterday, but in March, so the indicator worsened: 27.4 billion euros against 37.8 billion in February.
Today, US statistical services have to answer Europe. The Ministry of Labor will publish a weekly report on applications for unemployment benefits - a forecast of 2,400 million against 2,981 million a week earlier. The Philadelphia Manufacturing PMI is expected to improve from -56.6 to -40.0 in May, Manufacturing PMI is projected to grow slightly to 39.3 from 36.1, Services PMI is expected to reach 32.6 points from 26.7 in last month. We believe that all data will come out better than forecasts, regardless of whether this is true or not. We saw a similar picture in 2011 and 2014 during periods of tough confrontation between the US and the eurozone, when US statistics were subsequently revised to deteriorate.
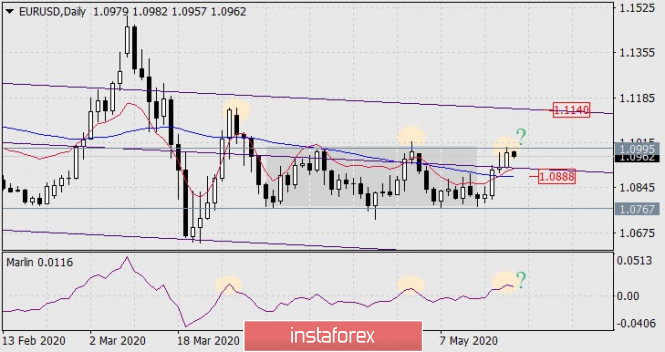
The euro worked out the upper limit of the trading range with a false on the daily chart, as it now seems, exit over the MACD indicator line and the embedded price channel line. Similar turns of the euro occurred on May 4 and March 30, these points are marked by sand-colored ovals. The Marlin oscillator begins to turn down.
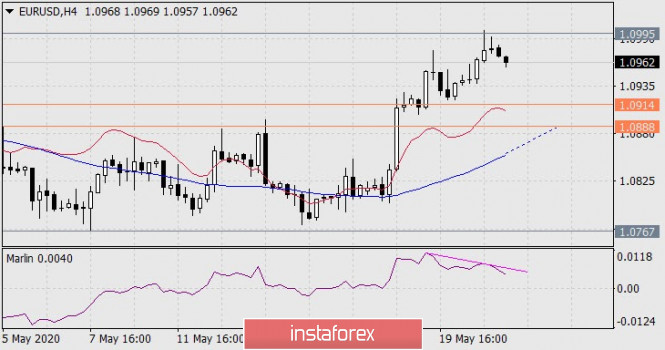
A divergence has formed on the four-hour chart on Marlin - a reversal pattern. Overcoming the price of the signal level of 1.0914 will correspond to the price falling below the line of the price channel on the daily chart. The 1.0888 level corresponds to the support of the MACD line on the daily chart, but then we see a coincidence with the expected support of the MACD line on a four-hour scope - the line tends to this level and can meet the price on it. Leaving the price below 1.0888 will return the market in anticipation of a medium-term decline.
The material has been provided by InstaForex Company - www.instaforex.com