
AUD/USD
Yesterday there was a collapse in the stock, commodity and commodity markets. With trading stops, the US stock index S&P 500 lost 9.51%, the European EuroStoxx50 collapsed by 12.35%, oil -6.98%, copper -2.90%, iron ore fell by 2.34%, meat futures lost up to 7%.
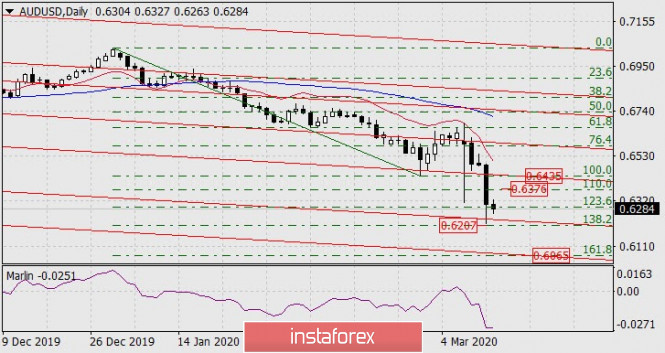
The Australian dollar fell by 180 points and the target for the Fibonacci level of 138.2% (0.6207) was reached at the peak of the decline. This is also where the price channel line runs on the daily scale chart. The signal line of the Marlin oscillator quickly entered the oversold zone, hence there may be a corrective growth of the indicator and the price itself. The price growth is likely to continue to the 110.0% Fibonacci level at 0.6376. The limit of growth is the intersection point of the 100.0% Fibonacci level with the price channel line at 0.6435. After the correction is complete, we expect the price to decline to the reaction level of 161.8% at the price of 0.6065. An embedded price channel line is also located in the area of the specified price.
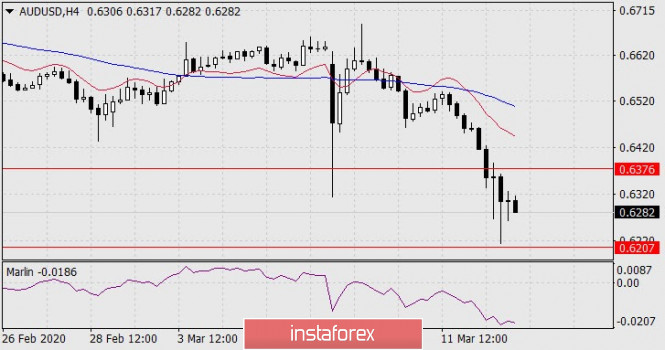
At the four-hour scale, the signal line of the Marlin oscillator turns up from the oversold zone, waiting for the correction to be completed.
The material has been provided by InstaForex Company - www.instaforex.com