4-hour timeframe
Technical details:
Higher linear regression channel: direction - downward.
Lower linear regression channel: direction - downward.
Moving average (20; smoothed) - down.
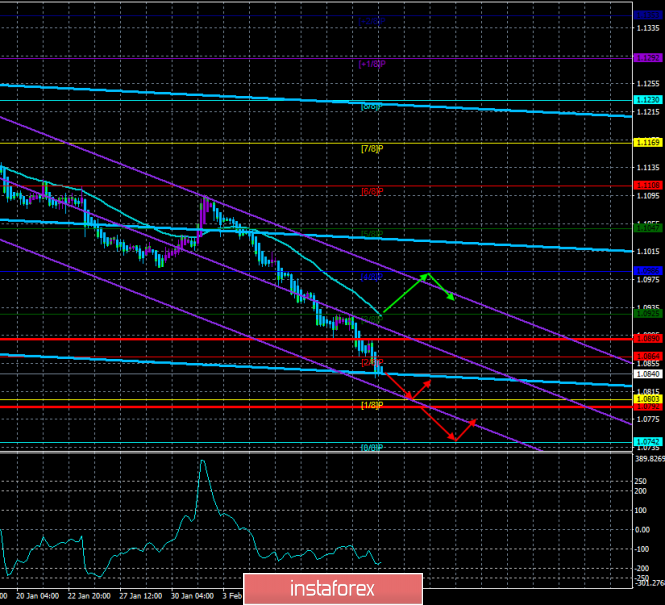
CCI: -174.0366
The European currency ended with a fall for the ninth day in a row. The recoilless downward movement continues for almost two weeks and there is no sign of the beginning of an upward correction. Just a couple of weeks ago, it was hard to imagine that the euro would so easily update two-year lows. After all, before that, it had been hovering around them for several months, having all the necessary factors at its disposal to continue falling against the US dollar. However, the ever - "paradoxical situation" could not save the EU currency and collapse followed in February. Now the main question is, when will the depreciation of the European currency end? The euro/dollar pair is steadily losing 40 points every day, and all macroeconomic reports are either unequivocally in favor of the US currency, or neutral for the euro. Thus, bears that have gained momentum do not have a fundamental reason to abandon their trading strategy.
On Thursday, February 13, all the attention of market participants was focused on German and American inflation. If there was little hope for the German consumer price index, then the American CPI was the hope of the euro bulls, since this indicator has been growing continuously in recent months, and any growth sooner or later ends. Moreover, once again forecasts predicted a new acceleration of inflation in the United States, which according to them was supposed to accelerate to 2.4% y/y. You will agree since Jerome Powell's uncertain comments about the Fed's desire to achieve a stable "about 2%" of inflation looked very optimistic. However, all the macroeconomic data turned out to be terribly prosaic. The consumer price index in Germany fully coincided with the forecast values and amounted to 1.7% y/y and -0.6% on a monthly basis. In the United States, inflation exceeded the forecast of 2.4% per annum, amounting to 2.5% y/y. No one was interested in the weaker-than-expected monthly growth rate. The consumer price index excluding volatile food and energy products was 2.3% y/y, which was also higher than the forecast values. Thus, once again, we have a situation in which European statistics were neutral and American statistics were strong. Therefore, from the point of view of fundamental analysis, what happened today is what should have happened – another strengthening of the dollar.
Now the last trading day of the week remains: the last chance for the euro to change something for the better. Obviously, the correction will start sooner or later. This may not even require strong statistics from the eurozone or weak statistics from the United States. Nevertheless, today may be the tenth day in a row in terms of the fall of the euro currency. And since a lot of important macroeconomic information will be published on this day, the fundamental factor will prevail in the markets.
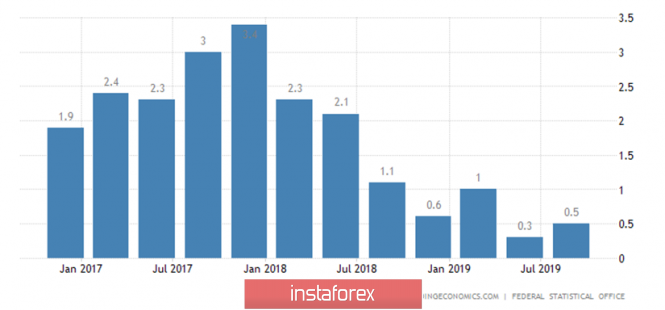
Today, the least significant report will begin the publication - GDP in Germany for the fourth quarter in a preliminary value. As you can see from the illustration, the most important indicator of the state of any economy in Germany in the last 7 quarters is only slowing down. The growth of the economy is still present, however, the last values are already very close to zero, which will mean the stagnation of the country's economy - the locomotive of the entire European Union. Forecasts predict another slowdown in growth, this time to 0.4% y/y. Compared to the previous quarter, an increase of 0.1% is expected.
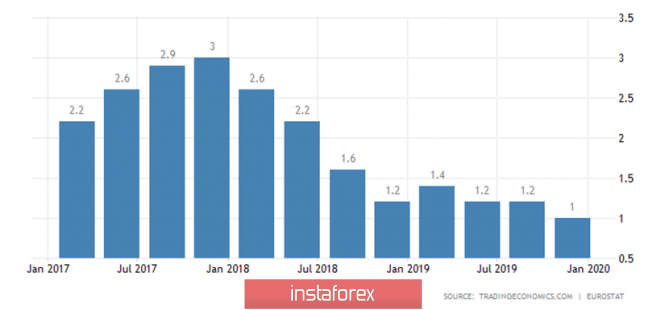
Next, a more significant GDP for the fourth quarter of the eurozone will be published, also in a preliminary value. The picture here is approximately the same as in Germany. The last 8 quarters - a slowdown in growth, the forecast for tomorrow - the preservation of 1.0% y/y and +0.1% in quarterly terms. Both of these GDP indicators should be higher than the forecast values for the euro to finally receive fundamental support. Given the fact that the rate of decline has been observed for 2 years in Germany and the EU, what are the chances that tomorrow we will see an acceleration? Especially, given that industrial production throughout the European Union continues to decline (that is, not to lose the growth rate, namely, to decline).
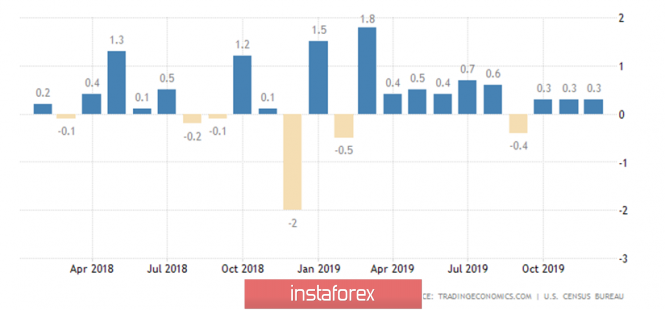
In the United States, the retail sales indicator will be published today, which is interesting but is not of the highest importance. According to experts, the indicator will grow by 0.3% in January, which is fully consistent with the values of the last three months, and excluding car sales, the increase will be the same 0.3% m/m.
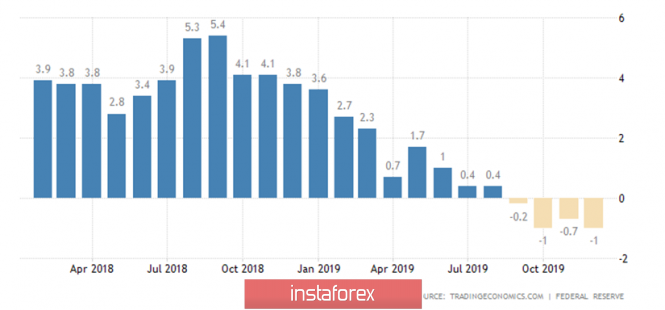
Much more important will be the indicator of industrial production in the United States, which confuses us along with the GDP indicator in recent weeks. Jerome Powell, the head of the Fed, also noted weak production in his last speech to the US Congress, although he did not show more global concerns about this. We believe that a further slowdown in production will inevitably lead to a drop in the growth rate, at least in GDP, and possibly in other indicators. This indicator is expected to lose between 1.2% and 1.4% in January. That is, if the forecasts come true, the rate of decline in industrial production will increase and, perhaps, this is the chance of the euro currency today. Although, of course, the GDP indicator in the European Union will be more important.
What is the result? As a result, a large number of statistics will be published on the last trading day of the week, which can be quite versatile. Support for both the dollar and the euro currency. Thus, we still recommend that traders do not miss the publication of important reports, but at the same time pay attention to fast indicators, such as Heiken Ashi, which can be the first to indicate the beginning of a correction, even if the actual values of the reports will not signal this. From a technical point of view, the drop continues, and the Heiken Ashi indicator continues to color the bars blue. Absolutely all indicators turned down.
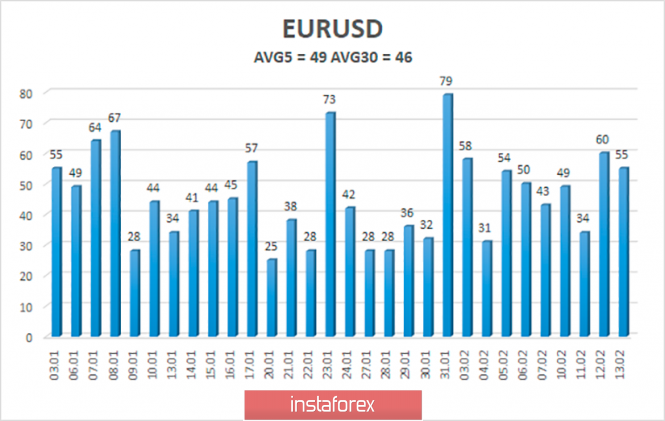
The average volatility of the euro/dollar currency pair has increased to 49 points per day, but in general, all recent volatility changes are minimal. On average, the pair passes 40-50 points per day. On Friday, we expect movement between the borders of the volatility range of 1.0792-1.0890. It doesn't make sense to close short positions before the Heiken Ashi indicator turns up.
Nearest support levels:
S1 - 1.0803
S2 - 1.0742
S3 - 1.0681
Nearest resistance levels:
R1 - 1.0864
R2 - 1.0925
R3 - 1.1047
Trading recommendations:
The euro/dollar pair continues to move down. Thus, sales of the euro currency with the targets of 1.0803 and 1.0742 remain relevant now, which can be kept open until the Heiken Ashi indicator turns up. It is recommended to buy the EUR/USD pair not before the bulls cross the moving average line, which will change the current trend to an upward one, with the first target of 1.0986.
In addition to the technical picture, you should also take into account the fundamental data and the time of their release.
Explanation of the illustrations:
The highest linear regression channel is the blue unidirectional lines.
The lowest linear regression channel is the purple unidirectional lines.
CCI - blue line in the indicator window.
Moving average (20; smoothed) - blue line on the price chart.
Murray levels - multi-colored horizontal stripes.
Heiken Ashi is an indicator that colors bars in blue or purple.
Possible variants of the price movement:
Red and green arrows.
The material has been provided by InstaForex Company - www.instaforex.com