
USD/JPY
Last Friday, the USD/JPY pair failed on the first attempt to overcome the resistance of the trend line of the red descending channel. This was prevented by the stock market - Friday's decline in the S&P 500 was 0.54%. Yesterday, the stock market grew 0.73% with a new record of 3352.26. The price is staying in the range between the indicator lines on the daily chart.
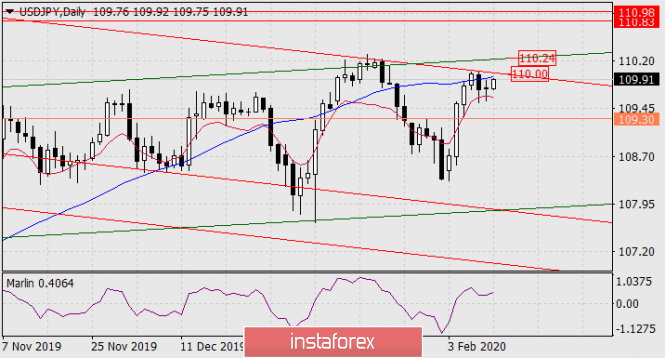
The resistance of the MACD line coincides with the embedded line of the price channel at 110.00. Overcoming this level will open 110.24 - the resistance of the green price channel of the higher TF. Exit above 110.24 opens the way to the range 110.83/98.
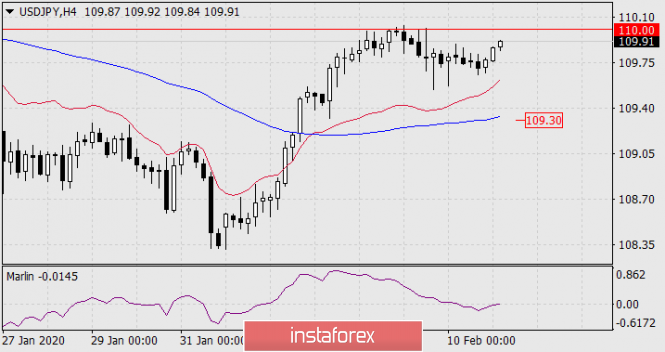
On a four-hour chart, the price is above all indicator lines, but the Marlin oscillator was in the negative zone. Of course, for the development of the main scenario, it needs to return to the growth zone as soon as possible. This will happen with price consolidation above yesterday's high.
The negative scenario suggests a fall in prices to the MACD line, to the area of 109.30. The likelihood of such a decrease of 10-15%.
The material has been provided by InstaForex Company - www.instaforex.com