
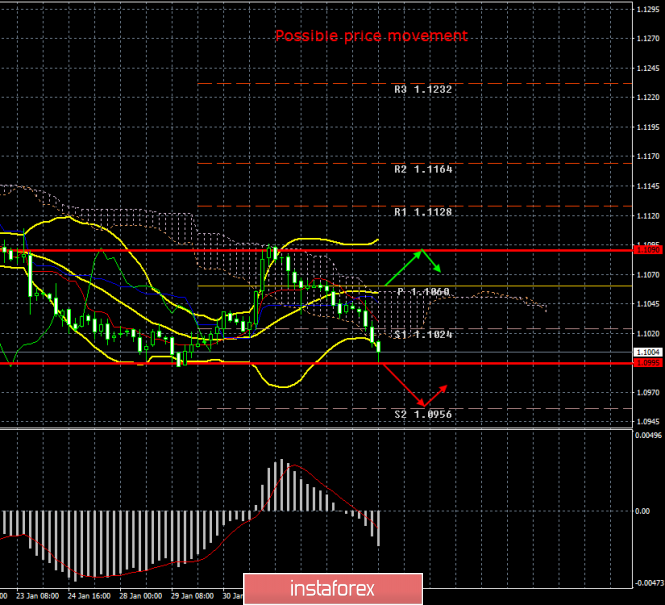
4 hour timeframe
Amplitude of the last 5 days (high-low): 36p - 32p - 79p - 58p - 31p.
Average volatility over the past 5 days: 48p (average).
Over the past months, we have repeatedly compared the economies of the United States and the European Union and have repeatedly concluded that it is on the basis of this factor that the downward trend for the EUR / USD pair remains. Today has confirmed once again that the euro has no special prospects and they are unlikely to appear in the near future. The third trading day of the week and February began with a calm downward movement. The pair euro-dollar crossed the critical line Kijun-sen, which has already called into question the resumption of the upward movement. Well, at the European trading session, it became clear that the downward trend would resume. Moreover, it is impossible to say with confidence that the trend has resumed and now we are going to move down for at least several days, since the same "paradoxical situation" comes into play, which we have already described many times. The thing is, that the pair, firstly, moved up to local lows near the level of 1.0992, and secondly, to two-year lows, to which there are about 100 points. It was in this area that the upward reversal took place repeatedly, even if the necessary macroeconomic statistics were available for further downward movement. Moreover, bears simply left these levels, and the next rollback occurs. It is difficult to say whether this will happen this time, but we warn traders that a pair reversal is very likely in the area of 1.0992 - 1.0879.
What happened today is that instead of the highly anticipated upward movement, traders began to get rid of the euro currency again, but actually it is not surprising. Just another package of nondescript macroeconomic statistics from the eurozone and another package strong - from across the world. Over the past few weeks, we have questioned the current "good" state of the US economy, as Jerome Powell said. However, recent evidence suggests the Fed chairman is truly right.
It all started with the publication of business activity in the EU countries. The most important indicators showed a minimal increase. So, in Germany, business activity in the services sector did not change compared to December and amounted to 54.2, while the indicator increased by 0.3, up to 52.5 in the European Union. However, we said this morning that indicators of business activity in the service sector are not so important for traders. The service industry does not cause such concerns as the manufacturing sector, it did not experience a particularly strong slowdown or decline. Thus, we can say that everything is stable in this area, and changes in indicators by 0.2-0.3 are not something special. But the next macroeconomic report showed that retail sales in the European Union in December declined by 1.6% in monthly terms (forecast -0.9%), and in annual terms, the growth rate slowed down to 1.3% (forecast + 2.4% y / y). It is completely disappointing, in other words, to characterize these statistics does not work. And although this report is not one of the most important and significant, the deviation from the forecast value was quite large, which provoked new sales of the European currency.
In addition, certain expectations of buyers of the euro were associated with US statistics. Information on similar business activity in the service sector, as well as data on changes in the number of new employees in the US private sector, was due to arrive from overseas today. And the very first report from overseas buried all the hopes of traders to strengthen the euro. The ADP report showed an increase of 291,000 new employees with a forecast value of +156,000 and the previous +202,000. A little later, it turned out that the business activity indexes in the Markit and ISM services sector also turned out to be better than experts expected, making 53.4 - the first and 55 5 - second. The growth of both indices was also not large, but just compare: the index for the EU services sector grew from 52.2 to 52.5, while the similar index in the USA grew from 55.0 to 55.5. That's the whole difference between the economies of the United States and the European Union. If both economies are slowing down, then the European is elementarily "behind" the American. If both economies are accelerating, then the US is making it at a faster pace. Moreover, the Fed has 7 or 8 more options to stimulate the economy in the event of new shocks by simply lowering the key rate. In the European Union, rates are already negative. The Fed formally conducts a quantitative easing program, but plans to curtail it in April and calls it "short-term measures to maintain liquidity in the financial sector." In turn, the ECB is conducting an official securities buyback program and is not going to complete it in the near future.
Trading recommendations:
The EUR/USD pair resumed the downward movement. Thus, it is now recommended to sell the euro with targets at levels 1.0995 and 1.0956, until the MACD indicator reverses or another sign of the start of correction. It will be possible to consider the purchase of the euro / dollar pair with the goals of 1.1090 and 1.1128, if traders manage to return quotes of the pair above the Kijun-sen and Senkou Span B. lines.
Explanation of the illustration:
Ichimoku indicator:
Tenkan-sen is the red line.
Kijun-sen is the blue line.
Senkou Span A - light brown dotted line.
Senkou Span B - light purple dashed line.
Chikou Span - green line.
Bollinger Bands Indicator:
3 yellow lines.
MACD indicator:
Red line and bar graph with white bars in the indicators window.
Support / Resistance Classic Levels:
Red and gray dashed lines with price symbols.
Pivot Level:
Yellow solid line.
Volatility Support / Resistance Levels:
Gray dotted lines without price designations.
Possible price movements:
Red and green arrows.
The material has been provided by InstaForex Company - www.instaforex.com