
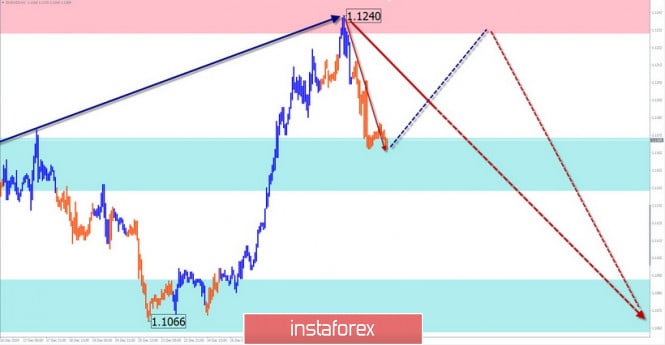
EUR/USD
Analysis:
The upward wave from September 3 to the present time demonstrates the completeness of its structure. The price has reached the lower limit of the wide potential reversal zone. In the last 3 days, the price moves down, forming a correction of the last part (C). The price is in the support area.
Forecast:
Due to the high wave level, the downward movement can be continued, turning into a full-fledged correction of the entire main wave. Today, the price is expected to move sideways. In the first half of the day, an upward vector is more likely. If the volatility decreases, the pair may increase.
Potential reversal zones
Resistance:
- 1.1230/1.1260
Support:
- 1.1170/1.1140
- 1.1090/1.1060
Recommendations:
Purchases of the euro are possible today as part of session trading with a reduced lot. Sales of the instrument will become more promising.
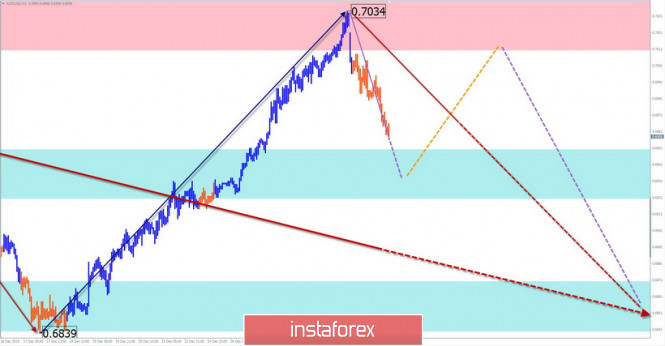
AUD/USD
Analysis:
The dominant wave on the chart of the "Australian" has a downward course but is formed in the form of an incorrect design. On the chart, it looks like an upward pennant. Its structure still lacks the final part. The price has reached an intermediate resistance level.
Forecast:
A reversal on the final decline can occur at any time. The trend change will likely occur from the current resistance. In the first half of the day, a rollback of the course is possible today. A lateral flat is likely, but a short-term rise to the resistance area is not excluded. A return to decline can be expected by the end of the day.
Potential reversal zones
Resistance:
- 0.7010/0.7040
Support:
- 0.6950/0.6920
- 0.6870/0.6840
Recommendations:
Buying a pair in the coming sessions can be risky. It is recommended that the main attention be paid to the search for instrument selling signals.
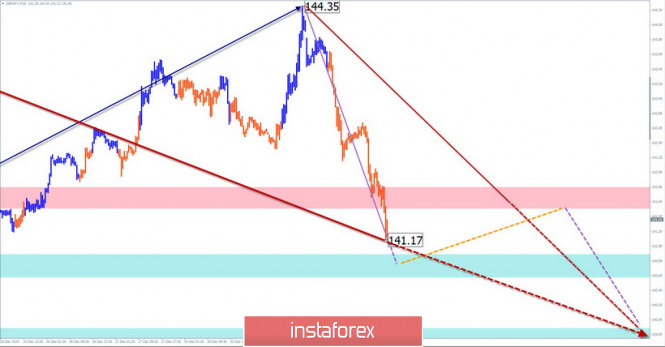
GBP/JPY
Analysis:
As part of the main wave, a bearish wave has been forming since December 13. Previously, it will take the place of correction of the entire wave. There was a clear zigzag in the structure of the movement. The decline that began on December 31 may give rise to the final part (C).
Forecast:
The downward trend of the cross movement is expected to continue in the coming sessions. The nature of the movement is likely to be impulsive.
A short-term pullback is possible from the nearest support. Most likely, there will be a "sideways", but the option of a rebound to the resistance zone cannot be excluded.
Potential reversal zones
Resistance:
- 141.60/141.90
Support:
- 141.00/140.70
- 140.00/139.70
Recommendations:
The purchase of the pair today is unpromising. At the ends of all counter price movements, it is recommended to track the reversal signals to find the pair's selling points.
Explanations: In the simplified wave analysis (UVA), waves consist of 3 parts (A-B-C). The last incomplete wave is analyzed. The solid background of the arrows shows the formed structure, the dotted background shows the expected movements.
Attention: The wave algorithm does not take into account the duration of the tool movements in time!
The material has been provided by InstaForex Company - www.instaforex.com