
Gold price is still trading inside of the multi week trading range between the price of $1.518 (top of the range) and $1.461 (bottom of the range).
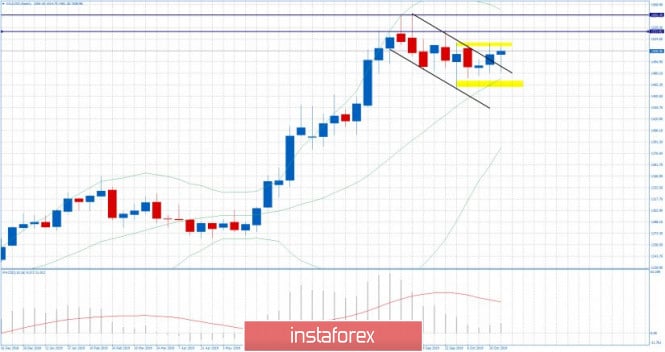
Yellow rectangles – trading range boundaries
Falling purple lines – Broken downward channel
Horizontal lines – Resistance levels
Last week I found the breakout of the downward channel (bull flag) and potential for new upward wave. Anyway, to confirm potential upside continuation on the weekly chart, I would like to see the breakout of resistance at $1.518, which will eventually lead for test of $1.533 or $1.555.
Eventual rejection of the resistance may lead the gold for rotation back into the support zone of the well defined bracket at the price of $1.475.
Middle Bollinger line is set at $1.472 and it is acting like good support zone.
Trading recommendation:
Watch for potential breakout of the multi-week bracketing zone.
The material has been provided by InstaForex Company - www.instaforex.com