
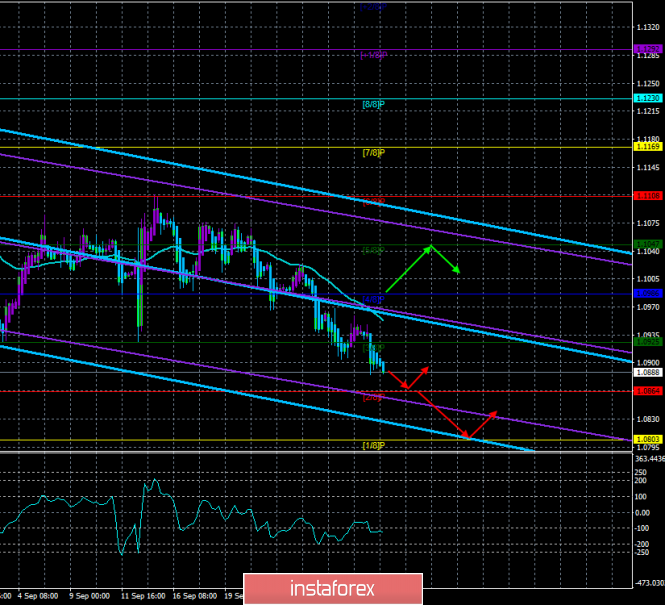
4-hour timeframe
Technical data:
The upper channel of linear regression: direction – down.
The lower channel of linear regression: direction – down.
The moving average (20; smoothed) – down.
CCI: -129.4507
The first trading day of the week for EUR/USD ended with another fall. It is even difficult to imagine what can now make traders change their attitude to the euro and the US dollar. The US dollar is still in high demand, the euro – do not pay much attention, even if there are fundamental reasons for this.
On October 1, America and the European Union will publish indices of business activity in the manufacturing sector. With Europe – everything is clear for a long time. The past value of the 45.6 indexes is much lower than the level of 50.0, above which it is believed that "everything is good" in industry and there is growth. That is, in principle, any value below 50.0 is considered negative. What are the chances that after several months of steady decline, suddenly the business activity index will rise above 50.0? From our point of view, scanty. Thus, we can hardly expect any support for the euro from this report. Also, a similar index will be published in Germany. But things are even worse in Germany. In August, the figure fell to 41.4. Thus, the hopes for the euro are once again linked to America and macroeconomic statistics from overseas. In the USA today, there will also be an index of business activity in the manufacturing sector, in two variations: from Markit and ISM. The first of them is projected to remain "on the verge" – 51.0, the second – may grow to 50.0 (previous value of 49.1). Thus, the fall of the first index under 50.0 and/or the lack of improvement of the second index to 50.0 will be bullish factors for the euro/dollar pair.
In addition to these rather interesting reports, the European Union will also release a preliminary value of inflation for September. Forecasts are neutral – 1.0% y/y, but we remember that the consumer price index in Germany slowed from 1.4% to 1.2% y/y, so there is every reason to assume a slowdown in European inflation. In this regard, traders again find themselves in a situation where the best thing that can happen today for the euro is not a decrease in inflation in the EU, and the fall of business activity indices in the US.
Well, the technical picture of the pair remains almost unambiguous. Both linear regression channels are directed downward, signaling a downward trend in the medium and long term. The moving average is directed downwards – the short-term trend is also downward. The Heiken Ashi indicator paints the bars blue – the intraday trend is also "down". In such conditions, the reversal of the Heiken Ashi indicator upward will indicate a correction of the pair to the moving average, but there is no such correction yet.
Nearest support levels:
S1 – 1.0864
S2 – 1.0803
S3 – 1.0742
Nearest resistance levels:
R1 – 1.0925
R2 – 1.0986
R3 – 1.1047
Trading recommendations:
The euro/dollar resumed its downward movement. Thus, it is recommended to continue selling the euro with targets of 1.0864 and 1.0803. It is not recommended to return to buying the currency pair now, as the bulls remain extremely weak.
In addition to the technical picture, fundamental data and the time of their release should also be taken into account.
Explanation of the illustrations:
The upper channel of linear regression – the blue lines of the unidirectional movement.
The lower channel of linear regression – the purple lines of the unidirectional movement.
CCI – the blue line in the indicator window.
The moving average (20; smoothed) – the blue line on the price chart.
Support and resistance – red horizontal lines.
Heiken Ashi – an indicator that colors bars in blue or purple.
The material has been provided by InstaForex Company - www.instaforex.com