Bulls managed to hold above 1.10-1.1030 last week giving promises for more upside in the coming days as price has broken above the short-term wedge pattern. Bulls need to hold above 1.10 otherwise we will see this breakout as a false/fake attempt for a bullish signal.
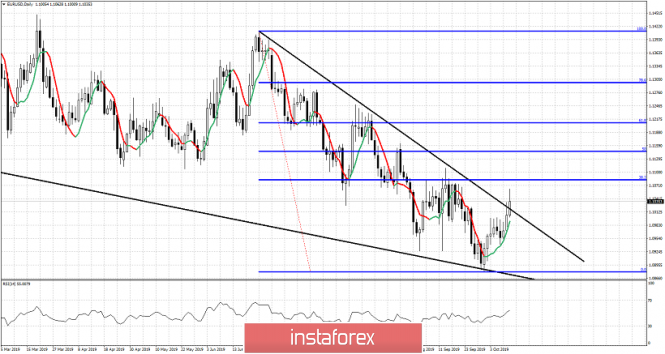
Black lines - wedge pattern
EURUSD has broken above the upper wedge boundary and is heading towards the 38% Fibonacci retracement of the recent decline from 1.1412. So first resistance is at 1.1085. Next important Fibonacci resistance is at 1.1210 and 1.1147. The RSI is positively sloped and still far away from overbought levels.
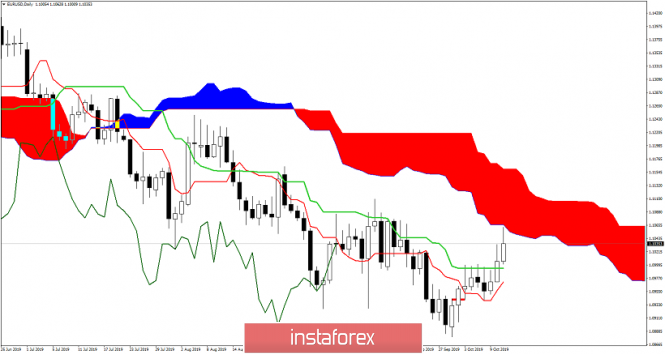
In the Daily Ichimoku cloud chart we observe price has reached the lower cloud boundary which is resistance and the Daily candlestick shows the presence of sellers there by an upper shadow. This does not mean that price could not continue higher over the coming week. However this chart says that we are now approaching important Daily resistance according to the Ichimoku indicator. Support is at the tenkan- and kijun-sen (green and red line indicators). As long as price is above these two, short-term trend will remain bullish.The material has been provided by InstaForex Company -
www.instaforex.com
