
Minor (H4)
"Raw" currencies - a comprehensive analysis of the development options for the movement of AUD / USD vs USD / CAD vs NZD / USD vs #USDX from October 16, 2019 on the Minor operational scale (Daily timeframe).
US dollar Index
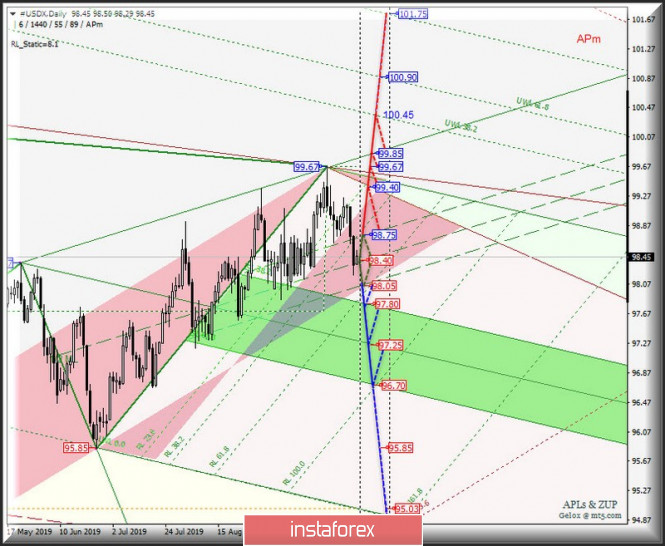
The movement of the dollar index #USDX from October 16, 2019 will continue to occur in the 1/2 Median Line channel (98.75 - 98.40 - 98.05) of the Minuette operational scale fork. See the animated chart for details. What will happen next? In case of breakdown of the above levels, we consider the scenario below:
The breakdown of the upper boundary of the 1/2 Median Line channel (resistance level of 98.05) of the Minuette operational scale fork will determine the upward target for the dollar index : the initial line SSL Minuette (99.40) - local maximum 99.67 - control line UTL Minuette (99.85) - warning line UWL 38.2 Minuette (100.45). In contrast, if the lower boundary of the 1/2 Median Line Minuette channel is broken (support level of 98.05), then it will become relevant for the #USDX to reach the boundaries of the equilibrium zone (97.80 - 97.25 - 96.70) of the Minuette operational scale fork with the prospect of reaching thelocal minimum of 95.85.
The markup of #USDX movement options from October 16, 2019 is shown in the animated chart.
____________________
Australian dollar vs US dollar
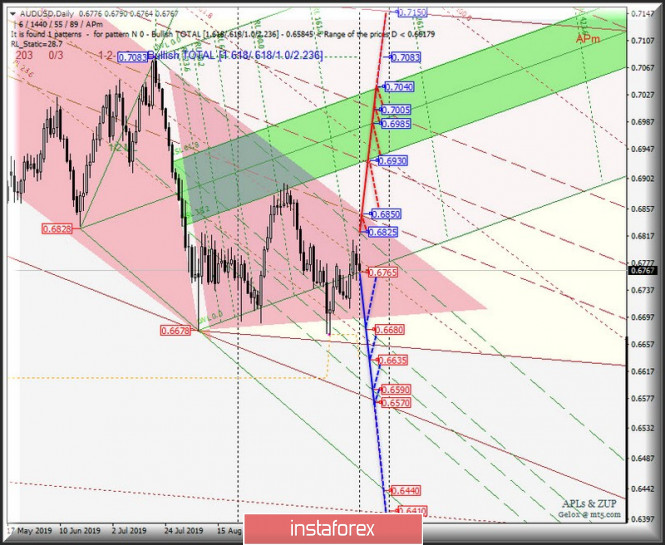
The Australian dollar AUD / USD will continue to develop its movement from October 16, 2019 depending on the development and direction of breakdown of the range:
- resistance level of 0.6825 (final Shiff Line Minuette operational scale fork);
- support level of 0.6765 (starting line SSL Minuette operational scale fork).
The breakdown of the SSL start line (support level of 0.6765) of the Minuette operational scale fork will direct the development of the Australian dollar movement to the boundaries of the 1/2 Median Line Minuette channel (0.6680 - 0.6635 - 0.6590) with the possibility of reaching the LTL control line (0.6570) of the Minor operational scale pitchfork.
On the contrary, the breakdown of the final Schiff Line Minuette (resistance level of 0.6825) is a variant of the development of the upward movement of AUD / USD to the boundaries of the 1/2 Median Line channel (0.6850 - 0.6930 - 0.7005) of the Minor operational scale fork and the equilibrium zone (0.6930 - 0.6985 - 0.7040) of the Minuette operational scale fork.
From October 16, 2019, we look at the layout of the AUD / USD movement options in the animated chart.
____________________
New Zealand dollar vs US dollar
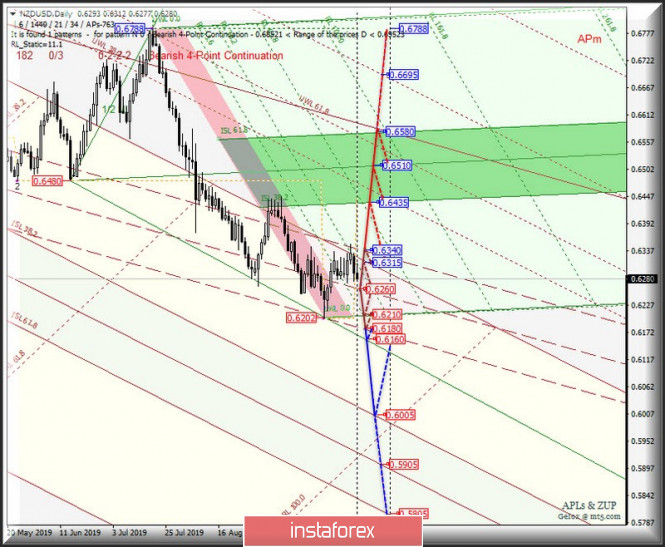
The development and direction of the breakdown of the 1/2 Median Line channel (0.6180 - 0.6260 - 0.6340) of the Minor operational scale will determine the development of the movement of the New Zealand dollar NZD / USD from October 16, 2019. The details of the movement within this channel are seen at the animated graphics.
The combined breakdown of the lower boundary of the 1/2 Median Line Minor channel (support level of 0.6120) and the LTL control line (0.6160) of the Minuette operational scale will direct the NZD / USD movement to the boundaries of the equilibrium zone (0.6005 - 0.5905 - 0.5805) Minor operational scale fork.
The breakdown of the upper boundary of the 1/2 Median Line channel (resistance level of 0.6340) of the Minor operational scale forks will determine the development of the movement of the New Zealand dollar to the boundaries of the equilibrium zone (0.6435 - 0.6510 - 0.6580) of the Minuette operational scale forks.
From October 16, 2019, we look at the markup of the NZD / USD movement options in the animated chart.
____________________
US dollar vs Canadian dollar
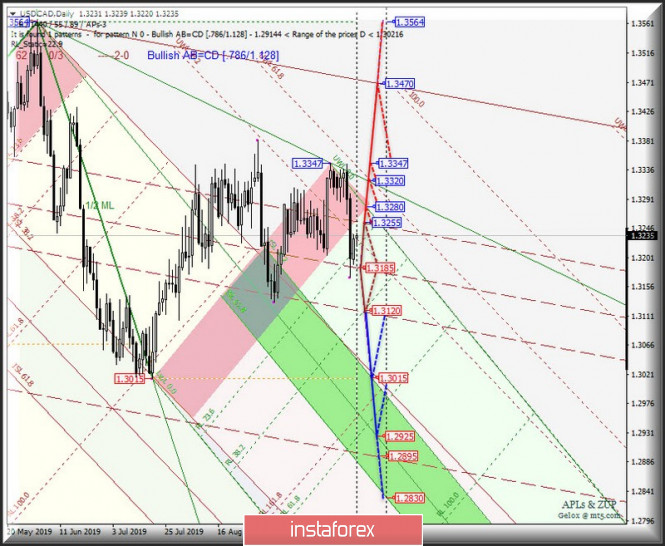
In addition, the development of the movement of the Canadian dollar USD / CAD from October 16, 2019 will be due to the development and direction of the breakdown of the boundaries of 1/2 Median Line channel (1.3255 - 1.3185 - 1.3120) of the Minor operational scale fork. The marking of the movement inside this channel is presented in the animated chart.
In case of breakdown of the upper boundary of the 1/2 Median Line channel (resistance level of 1.3255) of the Minor operational scale fork, the upward movement of the Canadian dollar can continue to the targets - the initial SSL line (1.3280) of the Minuette operational scale fork - control line UTL Minuette (1.3320) - local maximum 1.3347 with the prospect of reaching the control line UTL Minor (1.3470).
On the contrary, in case of breakdown of the lower boundary of the 1/2 Median Line channel (1.3120) of the Minor operational scale fork, the development of the USD / CAD movement will continue to the boundaries of the equilibrium zone (1.3015 - 1.2925 - 1.2830) of the Minuette operational scale fork.
From October 16, 2019, we look at the layout of the USD / CAD movement options in the animated chart.
____________________
The review is made without taking into account the news background. Thus, the opening of trading sessions of major financial centers does not serve as a guide to action (placing orders "sell" or "buy").
The formula for calculating the dollar index:
USDX = 50.14348112 * USDEUR0.576 * USDJPY0.136 * USDGBP0.119 * USDCAD0.091 * USDSEK0.042 * USDCHF0.036.
where the power coefficients correspond to the weights of the currencies in the basket:
Euro - 57.6%;
Yen - 13.6%;
Pound Sterling - 11.9%;
Canadian dollar - 9.1%;
Swedish Krona - 4.2%;
Swiss franc - 3.6%.
The first coefficient in the formula leads the index to 100 at the start date of the countdown - March 1973, when the main currencies began to be freely quoted relative to each other.
The material has been provided by InstaForex Company - www.instaforex.com