
Trend analysis (Fig. 1).
On Tuesday, the price may continue to move down to a pullback level of 38.2% - 1.2344 (blue dotted line). In case of breaking through this level, the continuation of the downward movement to the pullback level of 50.0% - 1.2270 (blue dashed line) is possible.
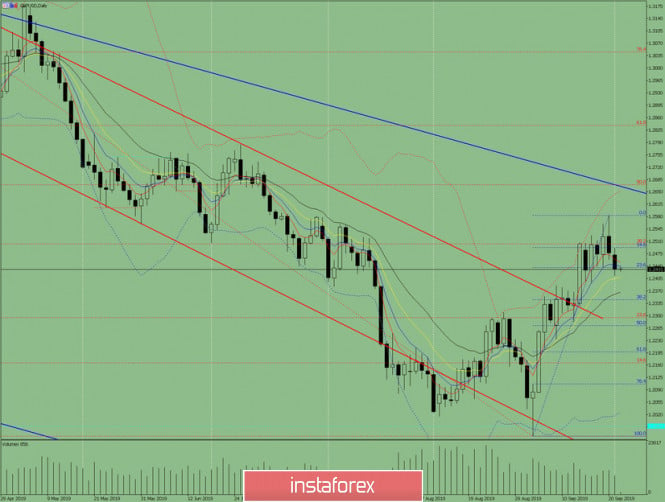
Fig. 1 (daily chart).
Comprehensive analysis:
- indicator analysis - down;
- Fibonacci levels - down;
- volumes - down;
- candlestick analysis - down;
- trend analysis - up;
- Bollinger Lines - down;
- weekly schedule - up.
General conclusion:
On Tuesday, the price may continue to move down.
The upward movement with the target of 1.2503, the pullback level of 38.2% (red dashed line) may begin after the news is released at 14.00 Universal time.
The material has been provided by InstaForex Company - www.instaforex.com