
4-hour timeframe
Technical data:
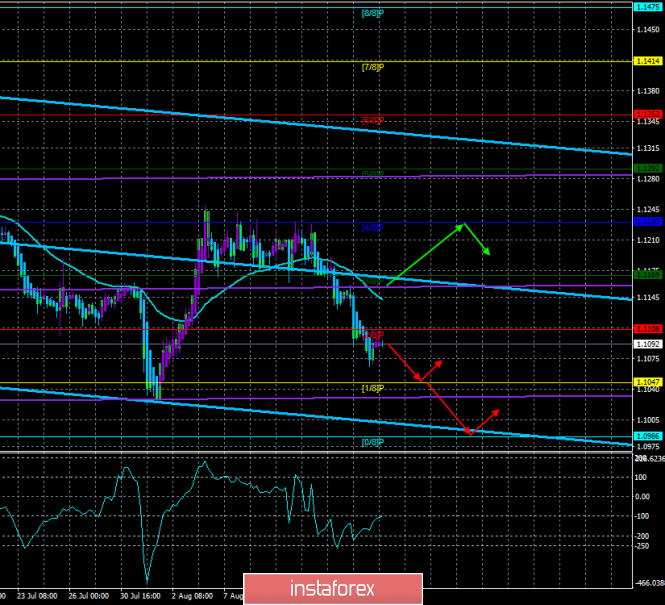
The upper linear regression channel: direction – down.
The lower linear regression channel: direction – sideways.
The moving average (20; smoothed) – down.
CCI: -102.3216
On August 19, the EUR/USD currency pair is in an upward correction phase. It sounds loud, but in reality, the Heiken Ashi indicator, designed to show intraday movements, just turned up, and the last three bars were scanty in size. Thus, we have a correction only formally. In fact, today, the fall of the euro/dollar pair may resume, as unlike other Mondays, today, there will be significant publications. By and large, only one important report will be released today – inflation in the EU in July. The forecast in annual terms is 1.1%, and in monthly terms -0.4%. Given the general trend and the situation in the European Union, it is possible that the real values of the indicator will be lower. Yes, in principle, the value of 1.1% in itself can serve as the basis for new sales of the euro, as it is very far from the target of 2.0% and brings the European economy to the rate reduction even faster. No more important publications are planned for today, and until Thursday, the calendar of macroeconomic events of the European Union and the States is empty. On Wednesday evening, the minutes of the meeting of the Federal Open Market Committee will be published, but we honestly do not remember the last time the market reacted to these reports. Yes, it will contain important information, but information that is already known to the market. Thus, traders will have to wait as much as Thursday to obtain fundamental information. The technical picture is clear – we need to wait for the turn of Heiken Ashi down and expect the pair to decline to 2-year lows, and, most likely, below.
Nearest support levels:
S1 – 1.1047
S2 – 1.0986
S3 – 1.0925
Nearest resistance levels:
R1 – 1.1108
R2 – 1.1169
R3 – 1.1230
Trading recommendations:
The euro/dollar pair is still being adjusted. Thus, to open new sales, we recommend waiting for the correction to be completed, which will be signaled by Heiken Ashi and re-sell the EUR/USD pair with the targets of 1.1047 and 1.0986. We are not talking about purchases now.
In addition to the technical picture, you should also take into account the fundamental data and the time of their release.
Explanation of illustrations:
The upper linear regression channel – the blue line of the unidirectional movement.
The lower linear regression channel – the purple line of the unidirectional movement.
CCI – the blue line in the indicator window.
The moving average (20; smoothed) – blue line on the price chart.
Murray levels – multi-colored horizontal stripes.
Heiken Ashi is an indicator that colors bars in blue or purple.
The material has been provided by InstaForex Company - www.instaforex.com