
Forecast for August 9 :
Analytical review of currency pairs on the scale of H1:
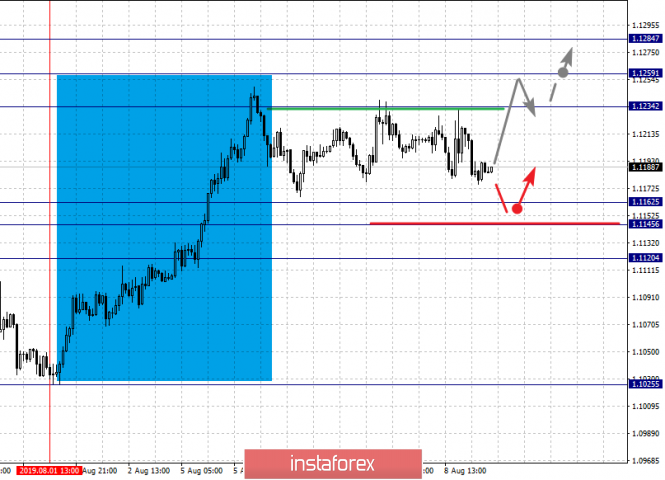
For the euro / dollar pair, the key levels on the H1 scale are: 1.1284, 1.1259, 1.1234, 1.1162, 1.1145 and 1.1120. Here, the price is in the correction zone from the ascending structure on August 1. The continuation of the upward trend is possible after the breakdown of the level of 1.1234. In this case, the target is 1.1259. For the potential value for the top, we consider the level of 1.1284, upon reaching which, we expect consolidation, as well as a pullback to the bottom.
Short-term downward movement is possibly in the range of 1.1162 - 1.1145. The breakdown of the last value will lead to a long correction. Here, the goal is 1.1120. This level is a key support for the top.
The main trend is the ascending structure of August 1, the correction stage.
Trading recommendations:
Buy 1.1234 Take profit: 1.1258
Buy 1.1261 Take profit: 1.1284
Sell: 1.1162 Take profit: 1.1146
Sell: 1.1144 Take profit: 1.1122
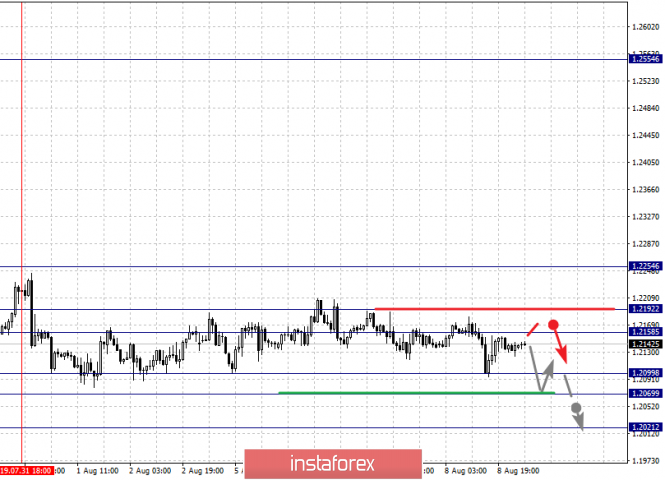
For the pound / dollar pair, the key levels on the H1 scale are: 1.2254, 1.2192, 1.2158, 1.2099, 1.2069 and 1.2021. Here, we follow the descending cycle of July 19, as well as the local descending structure of July 31. Short-term movement to the bottom is except in the range of 1.2099 - 1.2069. The breakdown of the latter value will allow us to expect movement to a potential target - 1.2021. We expect a correction to this level.
Short-term upward movement is possibly in the range of 1.2158 - 1.2192. The breakdown of the last value will lead to the formation of initial conditions for the top. Here, the potential target is 1.2254.
The main trend is the downward cycle of July 19, the local structure of July 31.
Trading recommendations:
Buy: 1.2158 Take profit: 1.2191
Buy: 1.2194 Take profit: 1.2254
Sell: 1.2099 Take profit: 1.2070
Sell: 1.2067 Take profit: 1.2025
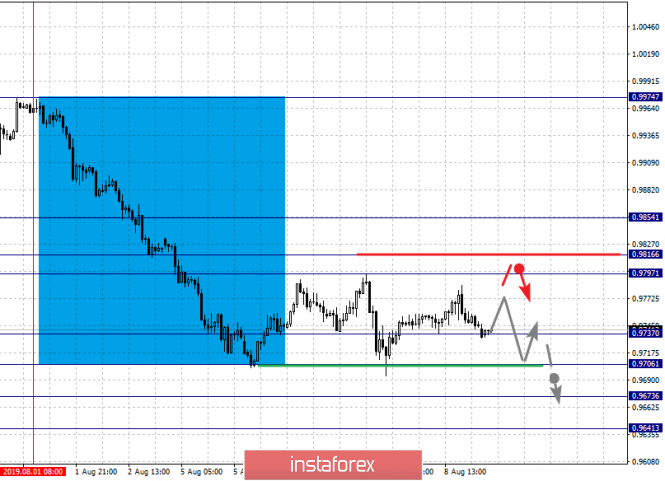
For the dollar / franc pair, the key levels on the H1 scale are: 0.9854, 0.9816, 0.9797, 0.9737, 0.9706, 0.9673 and 0.9641. Here, the price is in the correction zone from the downward structure on August 1. The continuation of the movement to the bottom is expected after the breakdown of the level of 0.9737. In this case, the target is 0.9706. Short-term downward movement, as well as consolidation is in the range of 0.9706 - 9637. We consider the level of 0.9641 to be a potential value for the bottom. Upon reaching which, we expect consolidation, as well as a rollback to the top.
Short-term upward movement is possibly in the range of 0.9797 - 0.9816. The breakdown of the latter value will lead to an in-depth correction. Here, the target is 0.9854. This level is a key support for the downward structure from August 1.
The main trend is the descending structure of August 1, the correction stage.
Trading recommendations:
Buy : 0.9797 Take profit: 0.9816
Buy : 0.9818 Take profit: 0.9852
Sell: 0.9735 Take profit: 0.9707
Sell: 0.9704 Take profit: 0.9675
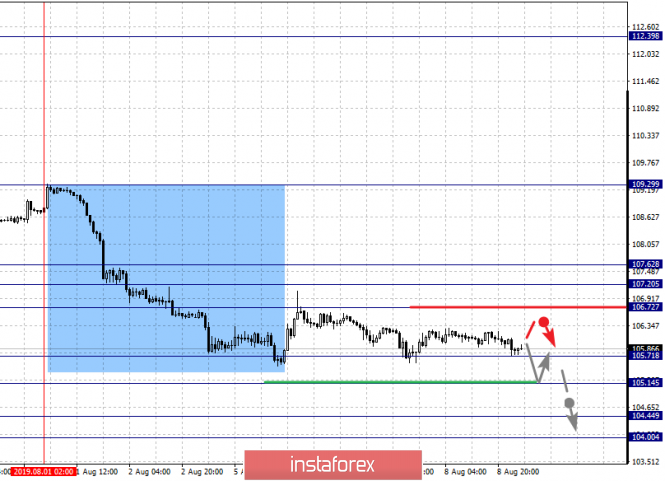
For the dollar / yen pair, the key levels on the scale are : 107.62, 107.20, 106.72, 105.71, 105.14, 104.44 and 104.00. Here, we follow the descending structure of August 1. The continuation of the movement to the bottom is expected after the breakdown of the level of 105.71. In this case, the goal is 105.14, and near this level is a price consolidation. The breakdown of the level of 105.14 should be accompanied by a pronounced downward movement. Here, the goal is 104.45. For the potential value for the bottom, we consider the level of 104.00. Upon reaching which, we expect a departure in the correction.
Departure to the correction zone is expected after the breakdown of the level of 106.72. Here, the goal is 107.20. The range of 107.20 - 107.62 is the key support for the downward structure.
The main trend: descending structure of August 1.
Trading recommendations:
Buy: 106.72 Take profit: 107.20
Buy : 107.22 Take profit: 107.62
Sell: 105.69 Take profit: 105.15
Sell: 105.13 Take profit: 104.46
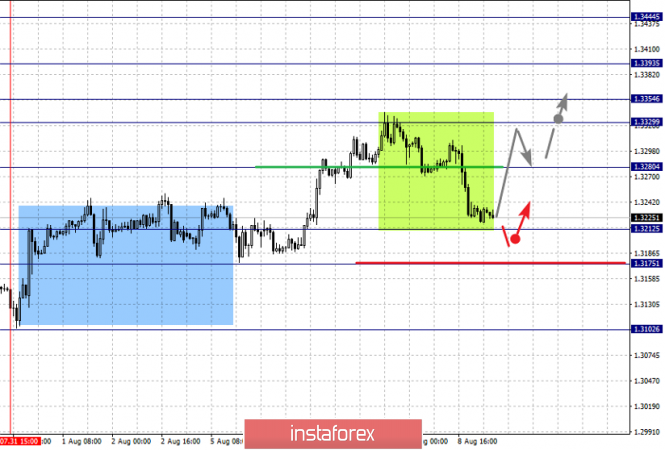
For the Canadian dollar / US dollar pair, the key levels on the H1 scale are: 1.3444, 1.3393, 1.3354, 1.3329, 1.3280, 1.3212, 1.3175 and 1.3102. Here, the price is in deep correction from the upward structure on July 31. The breakdown of the level of 1.3212 will lead to the formation of expressed initial conditions for the downward cycle. In this case, the potential target is 1.3175. Price consolidation is near this level. The continuation of the movement to the top is possible after the breakdown of the level of 1.3280. In this case, the first target is 1.3329. Consolidation is in the range of 1.3329 - 1.3354. The breakdown of the level of 1.3355 should be accompanied by a pronounced upward movement. Here, the target is 1.3393.
The main trend is the local ascending structure of July 31, the stage of deep correction.
Trading recommendations:
Buy: 1.3280 Take profit: 1.3329
Buy : 1.3355 Take profit: 1.3392
Sell: 1.3212 Take profit: 1.3178
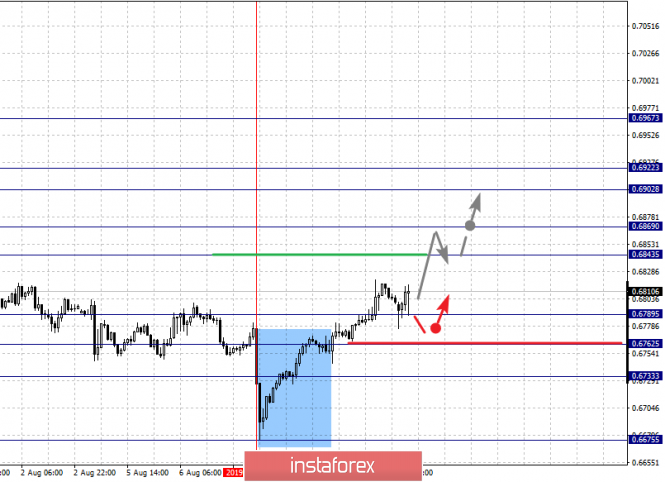
For the Australian dollar / US dollar pair, the key levels on the H1 scale are : 0.6967, 0.6922, 0.6902, 0.6869, 0.6843, 0.6789, 0.6762 and 0.6733. Here, we follow the development of the ascending structure of August 7th. At the moment, we expect a movement to the level of 0.6843. Short-term upward movement, as well as consolidation is in the range of 0.6843 - 0.6869. The breakdown of the level of 0.6870 should be accompanied by a pronounced upward movement. Here, the target is 0.6902. Price consolidation is in the range of 0.6902 - 0.6922. For the potential value for the top, we consider the level of 0.6967. Upon reaching which, we expect a pullback to the bottom.
Short-term downward movement is possibly in the range of 0.6789 - 0.6762. The breakdown of the latter value will lead to an in-depth correction. Here, the target is 0.6733. This level is a key support for the upward structure.
The main trend is the formation of initial conditions for the upward cycle of August 7.
Trading recommendations:
Buy: 0.6845 Take profit: 0.6867
Buy: 0.6870 Take profit: 0.6902
Sell : 0.6787 Take profit : 0.6764
Sell: 0.6760 Take profit: 0.6735
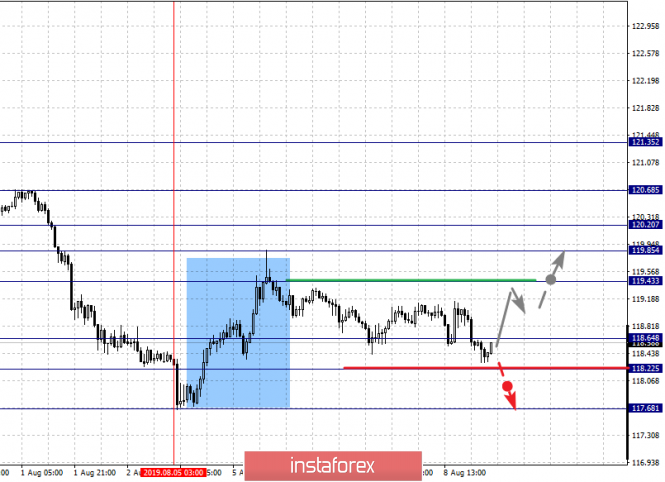
For the euro / yen pair, the key levels on the H1 scale are: 120.68, 120.20, 119.85, 119.43, 118.94, 118.64, 118.22 and 117.68. Here, the price is in deep correction from the ascending structure on August 5. The cancellation of this structure requires the breakdown of the level of 118.20. In this case, the first potential target is 117.68. The continuation of the movement to the top is expected after the breakdown of the level of 119.43. In this case, the target is 119.85. Consolidation is in the range of 119.85 - 120.20. The breakdown of the level of 120.20 should be accompanied by a pronounced upward movement. Here, the goal is 120.68. For the potential value for the top, we consider the level of 121.35.
The main trend is the initial conditions for the top of August 5, the stage of deep correction.
Trading recommendations:
Buy: 119.45 Take profit: 119.85
Buy: 120.20 Take profit: 120.68
Sell: 118.62 Take profit: 118.24
Sell: 118.20 Take profit: 117.72
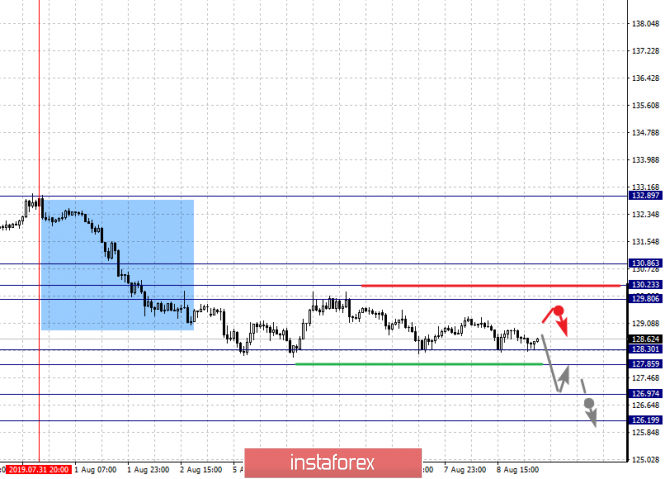
For the pound / yen pair, the key levels on the H1 scale are : 130.86, 130.23, 129.80, 128.98, 128.30 and 127.85. Here, we follow the local descending structure of July 31. The continuation of movement to the bottom is expected after the price passes the noise range 128.30 - 127.85. In this case, the target is 126.97. For the potential value for the bottom, we consider the level of 126.19. Upon reaching which, we expect a pullback to the top.
The range of 129.80 - 130.23 is the key support. Its breakdown will allow counting on movement to the level of 130.86, which is a key resistance for the subsequent development of the upward trend.
The main trend is the local descending structure of July 31.
Trading recommendations:
Buy: 130.26 Take profit: 130.84
Sell: 127.85 Take profit: 127.00
Sell: 126.95 Take profit: 126.20
The material has been provided by InstaForex Company - www.instaforex.com