
To open long positions on EURUSD you need:
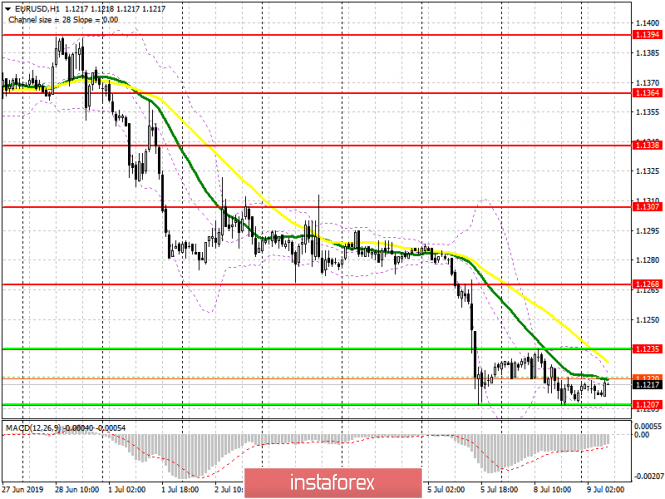
Yesterday's reports in Germany did not allow the pair to get out of the narrow side channel. Currently, buyers will expect to form a false breakdown around the 1.1207 low, and only in this scenario can you consider long positions in the euro with the main goal of breaking through and consolidating above a resistance of 1.1235, from which we can expect an update of a 1.1268 high and take profits on long positions. If the bears break through support at 1.1207, and this can happen during Fed chairman Jerome Powell's speech, then it is best to consider buying EUR/USD from lows of 1.1182 and 1.1161 lows.
To open short positions on EURUSD you need:
Today, bears will try to break through below support for 1.1207, however, it is necessary to wait for the speech of the Fed chairman, who may voice the further fate of interest rates. The breakthrough of 1.1207 will provide pressure on EUR/USD, which will lead to a test of lows of 1.1182 and 1.1161, where I recommend taking profits. The best scenario for selling the euro in the first half of the day would be a false breakdown in the resistance area of 1.1235, but I recommend only opening short positions to rebound immediately from a high of 1.1268.
Indicator signals:
Moving averages
Trade is conducted below 30 and 50 moving averages, which indicates a further decline in the market with the trend.
Bollinger bands
Volatility is very low, which does not provide signals for entering the market.
Description of indicators
- MA (moving average) 50 days - yellow
- MA (moving average) 30 days - green
- MACD: fast EMA 12, slow EMA 26, SMA 9
- Bollinger Bands 20