
To open long positions on EURUSD you need:
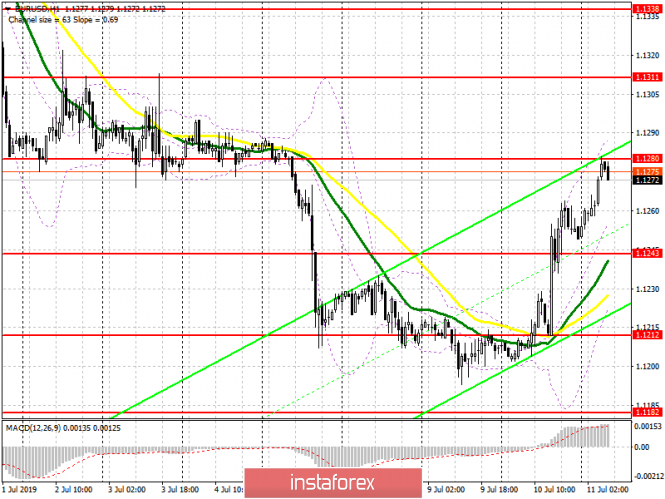
The Fed's statements from yesterday led to a weakening of the US dollar. At the moment, euro buyers need a breakout and consolidation above the resistance of 1.1280, which will continue the upward impulse and lead to the renewal of highs around 1.1311 and 1.1364, where I recommend taking profits. In case the euro declines in the first half of the day, long positions can be seen from a support of 1.1243 or rebound from a large low of 1.1212. The main movement will depend on US inflation data.
To open short positions on EURUSD you need:
Euro sellers can count on a false breakdown of resistance at 1.1280, which will lead to a downward correction in the pair and the intermediate support test of 1.1243, from which growth has continued this morning. However, only a breakthrough of 1.1243 with good inflation data in the US could provide the necessary pressure on EUR/USD and a return to lows of 1.1212 and 1.1182, where I recommend taking profits. With the growth scenario for the trend, you can sell the euro on a rebound from highs of 1.1311 and 1.1338.
Indicator signals:
Moving averages
Trading is conducted above 30 and 50 moving averages, which indicates a trend change.
Bollinger bands
If the euro falls, support will be provided by the lower limit of the indicator in the region of 1.1230.
Description of indicators
- MA (moving average) 50 days - yellow
- MA (moving average) 30 days - green
- MACD: fast EMA 12, slow EMA 26, SMA 9
- Bollinger Bands 20