
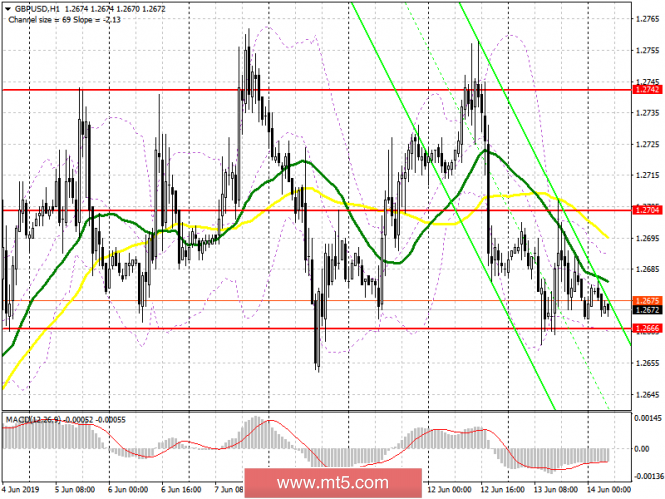
To open long positions on GBP/USD you need:
Euro buyers may have a lot of problems if support for 1.2666 is broken. The main task for the first half of the day will be the formation of a false breakdown in this range, which will allow us to expect a re-growth by the middle of the side channel of 1.2704, as well as an update of the upper limit in the 1.2742 area, where I recommend taking profits. In case of a breakthrough scenario of 1.2666, it is best to buy the pound from a low of 1.2643 or from a larger support of 1.2617.
To open short positions on GBP/USD you need:
Pound sellers need to break below the support of 1.2666, which will keep the pressure on the pair and will lead to updating a larger area of 1.264, where I recommend taking profits in the first half of the day. The main weekly goal of sellers will be the 1.2617 area. Under the GBP/USD growth scenario in the first half of the day, it is best to rely on short positions on a false breakdown from a resistance of 1.2704 or on a rebound from a weekly high in the area of 1.2742.
Indicator signals:
Moving averages
Trading is below 30 and 50 moving averages, which indicates a further decrease in the pound.
Bollinger bands
If the pound grows, the upper limit of the indicator in the area of 1.2690 will act as resistance, while the lower limit of the indicator near 1.2666 may provide support.
Description of indicators
- MA (moving average) 50 days - yellow
- MA (moving average) 30 days - green
- MACD: fast EMA 12, slow EMA 26, SMA 9
- Bollinger Bands 20