
To open long positions on EURUSD you need:
Traders continue to buy euros in the expectation of lower rates in the US, but they forget that the ECB may resort to such a mechanism in the near future and then everything will go in the opposite direction. Today, the task of euro buyers will be the resistance of 1.1392, consolidating above which will lead to highs of 1.1427 and 1.1459, where I recommend taking profits. However, a more optimal scenario for long positions would be a downward correction and a false breakdown in the 1.1366 area or a test of a larger low of 1.1338.
To open short positions on EURUSD you need:
There is no expected release of important fundamental data for today that could limit the upward potential of the euro. The formation of a false breakdown in the 1.1392 area will be the first signal to sell EUR/USD with the aim of forming a downward correction in the support area of 1.1366 and the test of a low of 1.1338, where I recommend taking profits, as the lower limit of the current ascending channel is located just below this range. When the growth scenario is above 1.1392 in the first half of the day, large resistance levels can be seen in the highs of 1.1427 and 1.1459, from where you can sell the euro immediately to rebound.
Indicator signals:
Moving averages
Trade is conducted above 30 and 50 moving averages, which indicates the formation of a bullish market.
Bollinger bands
The upper limit of the indicator in the area of 1.1410 will act as resistance, while the downward potential in the pair will be limited to the middle of the channel in the 1.1366 area and its lower limit in the area of 1.1315.
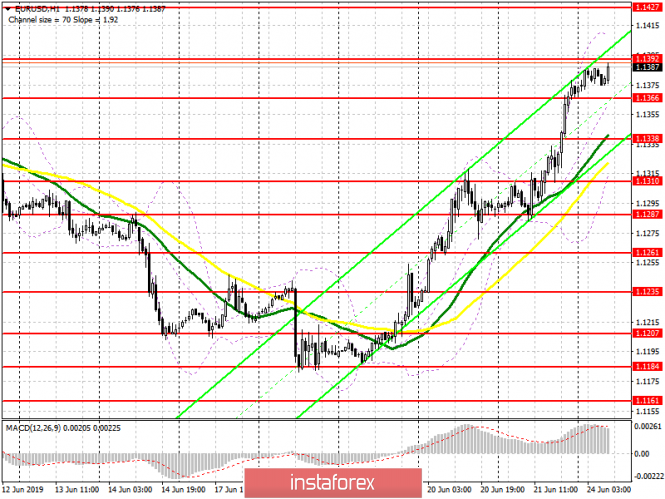
Description of indicators
- MA (moving average) 50 days - yellow
- MA (moving average) 30 days - green
- MACD: fast EMA 12, slow EMA 26, SMA 9
- Bollinger Bands 20