
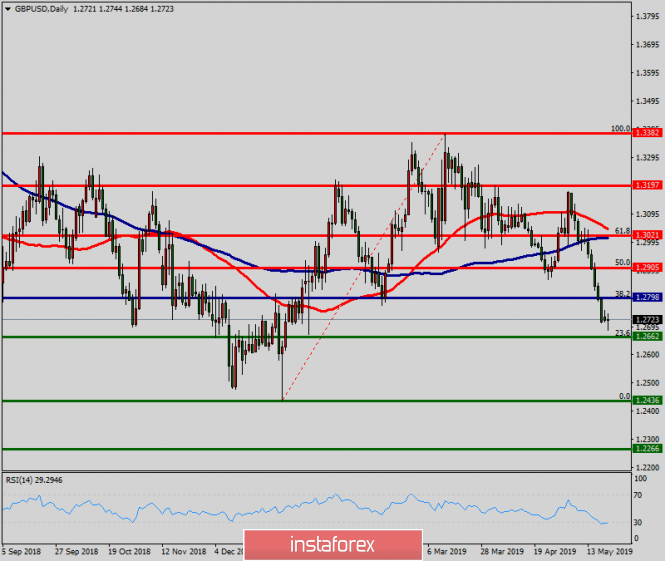
The GBP/USD pair continues to move downwards from the level of 1.2905. This week, the pair rose from the level of 1.2905 to a top around 1.2800 and it set around the spot of 1.2800. The first resistance level is seen at 1.2905 followed by 1.2963 , while daily support 1 is seen at 1.2798 (38.2% Fibonacci retracement). According to the previous events, the GBP/USD pair is still moving between the levels of 1.2700 and 1.2610; so we expect a range of 90 pips in coming hours. Furthermore, if the trend is able to break out through the first support level at 1.2662, we should see the pair climbing towards the double bottom (1.2436) to test it later. Therefore, sell below the level of 1.2800 with the first target at 1.2610 in order to test the daily resistance 1 and further to 1.2436. Also, it might be noted that the level of 1.2436 is a good place to take profit because it will form a double bottom. On the other hand, in case a reversal takes place and the GBP/USD pair breaks through the resistance level of 1.2905, then the stop loss should be placet at 1.2930.
The material has been provided by InstaForex Company - www.instaforex.com