Technical Market Overview:
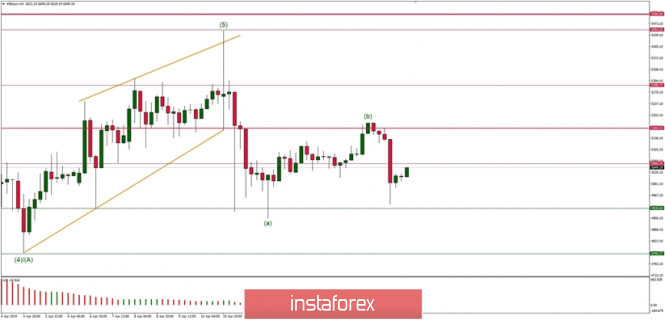
The BTC/USD pair has made a top for the wave b at the level of $5, 181 and after the Bearish Engulfing candlestick pattern occurred at the H4 timeframe chart, the market reversed suddenly and moved down towards the technical support at the level of $4,928. The support has not been hit, but it looks like a matter of time for the bears to test this level and move even deeper towards the level of $4,795. Please notice, there is still one more wave to the downside missing, the wave (c) and only after this wave is completed, the uptrend should resume.
Weekly Pivot Points:
WR3 - $5,898
WR2 - $5,642
WR1 - $5,340
Weekly Pivot - $5,108
WS1 - $4,789
WS2 - $4,547
WS3 - $4,228
Trading Recommendations:
The best trading strategy for this market for daytraders is to trade with the longer-timeframe trend, which is now uptrend. The best level for opening the buy orders is around the level of $4,800. This point of view is valid as long as the technical support at the level of $4,795 is broken.