
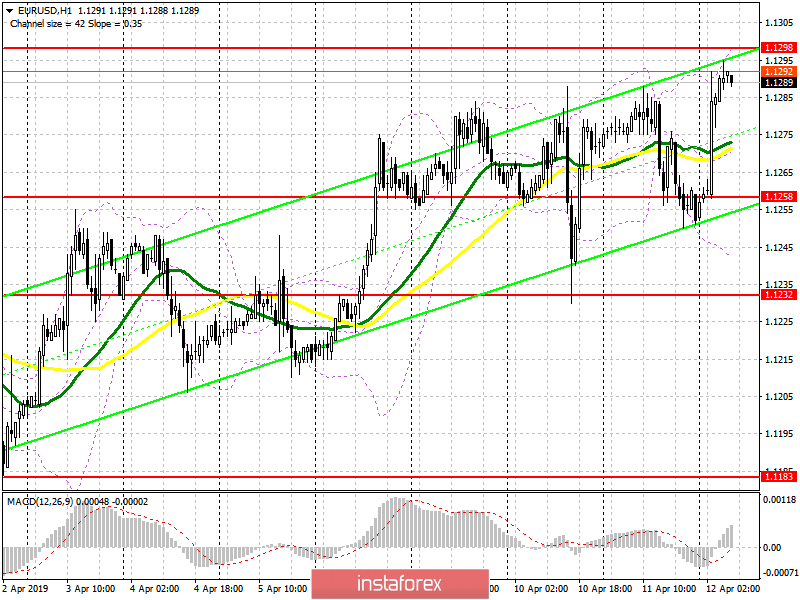
To open long positions on EURUSD you need:
Yesterday's US data only led to a temporary strengthening of the US dollar, but today at the Asian session, the demand for the euro has returned, which again confuses. It is best to rely on new purchases after a decline and the formation of a false breakdown in the support area of 1.1258, which will lead to an update of this week's high in the area of 1.1298. A breakthrough of this level will form a new uptrend, allowing you to update highs in the area of 1.1324 and 1.1358, where I recommend to take profits. In case the euro declines in the first half of the day below the support of 1.1258, it is best to consider new long positions to rebound from a large low in the area of 1.1232 and 1.1183.
To open short positions on EURUSD you need:
In the first half of the day, sellers can show themselves only after the formation of a false breakdown in the resistance area of 1.1298, which will lead to renewed pressure on the euro and a decline in the support area of 1.1258. However, the main task of sellers will be a breakthrough of this level with a test of the low in the region of 1.1232 and 1.1183, where I recommend taking profits. When the EUR/USD growth scenario is above 1.1298 in the first half of the day, it is best to consider short positions on a rebound from a high of 1.1324.
Indicator signals:
Moving averages
Trade is conducted in the region of 30 and 50 moving averages, which indicates market uncertainty.
Bollinger bands
Only a break of the upper border of the Bollinger Bands indicator in the area of 1.1298 will lead to the resumption of the uptrend.
Description of indicators
- MA (moving average) 50 days - yellow
- MA (moving average) 30 days - green
- MACD: fast EMA 12, slow EMA 26, SMA 9
- Bollinger Bands 20