
Gold price is showing reversal signs. As I explained in our last analysis, Gold price is most probably going to bounce towards the $1,300 level. Bulls need to reclaim this level and stay above it, otherwise we might see another sell off towards $1,260.
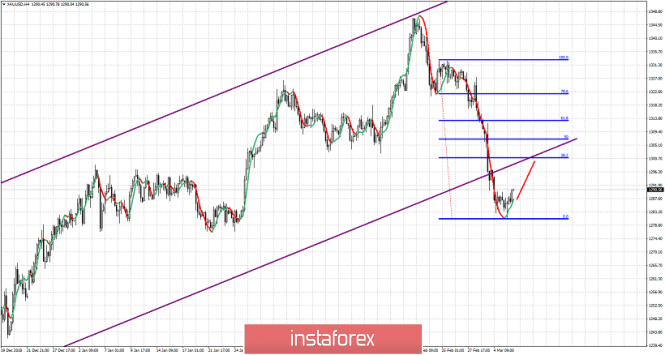
Purple lines - bullish channel
Red line - expected path
Gold price has broken down and out of the bullish channel. Gold price is expected to make at least a back test of the lower channel boundary and the 38% Fibonacci retracement of the decline from $1,333. Gold is expected to move towards $1,300 where we find the first important resistance. $1,313 and $1,321 are the next important resistance levels to watch out for. Bulls need to steadily start a new upward move with higher highs and higher lows and break above these levels in order to hope for a new yearly high towards $1,360 or higher. On the other hand bears need to see a rejection after this bounce for a move lower towards $1,250-60 to complete the first leg down from $1,346.
The material has been provided by InstaForex Company - www.instaforex.com