
EUR/USD has pulled back towards 1.13 which is important short-term support and so far it holds above this level. There are some bearish reversal signs in the short-term 4-hour chart but we will need more signs of weakness to confirm the reversal.
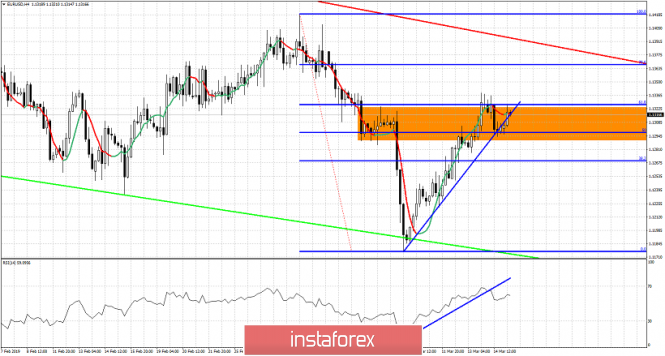
Blue lines - support trend lines
Green line - support
Orange rectangle - resistance area
EUR/USD has stopped its rise inside the orange rectangle resistance area. This is where we also find the 61.8% Fibonacci retracement level. EUR/USD has pulled back towards the short-term support of 1.13-1.1290 we mentioned yesterday and continues to trade above it at the same time not clearly breaking below the blue upward sloping trend line. The RSI has broken through the blue support trend line. For this reversal to be confirmed bears need to see a lower low both in price and in the RSI. Therefore bulls must defend 1.1293. A four close below this level could push price towards 1.1240 or lower. I remain bearish as long as price is below the red resistance trend line.
The material has been provided by InstaForex Company - www.instaforex.com