
To open long positions on EURUSD you need:
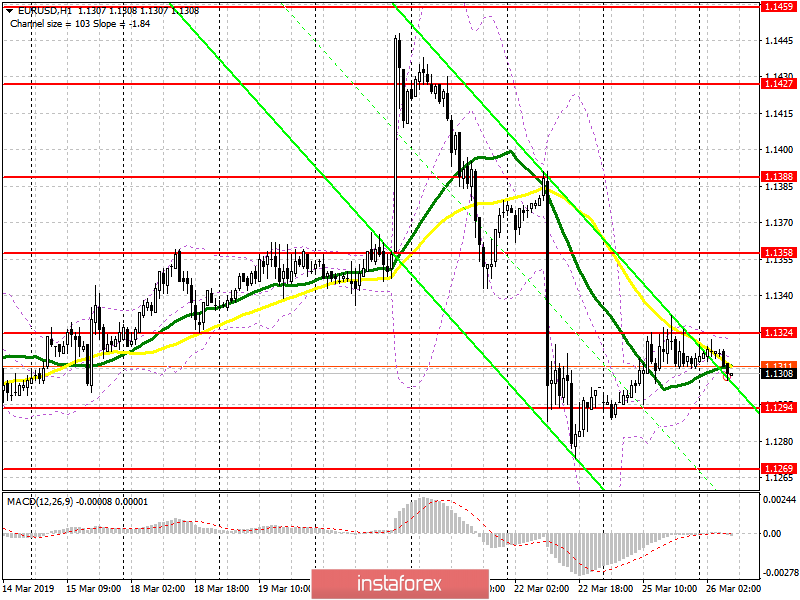
Good data from the IFO Institute of Germany provided only temporary support for the euro and did not allow bulls to continue the upward correction. At the moment, buyers need to stay above the support at 1.1294, and the formation of a false breakout there will be a signal to open long positions in order to increase towards the area of 1.1324. A breakthrough of this level will lead to a test of a high of 1.1358, where I recommend taking profits. In case the EUR/USD further declines, for example, after weak data on the French economy, it is best to return to long positions after updating last week's low to 1.1269 or to rebound from the support of 11247.
To open short positions on EURUSD you need:
Like yesterday, sellers of the European currency will try to prevent growth above the resistance of 1.1324, and the formation of a false breakout there will be a signal to sell the euro with a trend, in order to break through and consolidate below the support of 1.1294. Such a scenario will lead to the formation of a new downward wave and the renewal of lows for the week in the area of 1.1269 and 1.1247, where I recommend to lock in the profit. If data for France turns out to be better than expected, short positions in EUR/USD can only be considered for a rebound from resistances of 1.1258 and 1.1388.
Indicator signals:
Moving averages
Trade is conducted in the area of 30-day and 50-day moving averages, which indicates the formation of the lateral nature of the market.
Bollinger bands
The volatility of the Bollinger Bands indicator has significantly decreased, which does not provide signals on entering the market.
Description of indicators
- MA (moving average) 50 days - yellow
- MA (moving average) 30 days - green
- MACD: fast EMA 12, slow EMA 26, SMA 9
- Bollinger Bands 20