Technical market overview:
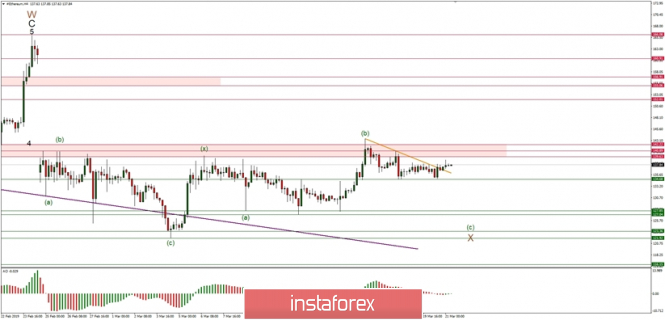
The ETH/USD has finally made a move and has broken above the short-term trendline resistance around the level of 137.00. Despite the breakout, the rally after the breakout was not that strong and the price is now again trading in a narrow range with the nearest target seen at the level of 139.63, which is the lower boundary to the technical resistance. The nearest technical support at the level of 134.68 has already been tested, but this is not the end of the down move as the wave (c) is still being made. The next target is seen at the level of 127.85 and this bearish bias is valid as long as the orange trendline is not violated.
Weekly Pivot Points:
WR3 - 162.50
WR2 - 153.11
WR1 - 146.18
Weekly Pivot - 134.66
WS1 - 129.36
WS2 - 120.05
WS3 - 112.99
Trading recommendations:
The bearish wave progression to the downside has still not been completed, so only sell orders should be placed as close as possible to the level of 140.89 with a target seen at the level of 134.89 and if this level is violated - at 127.85. Please notice, the trendline (marked in orange) cannot be violated, otherwise, the scenario will be updated.