
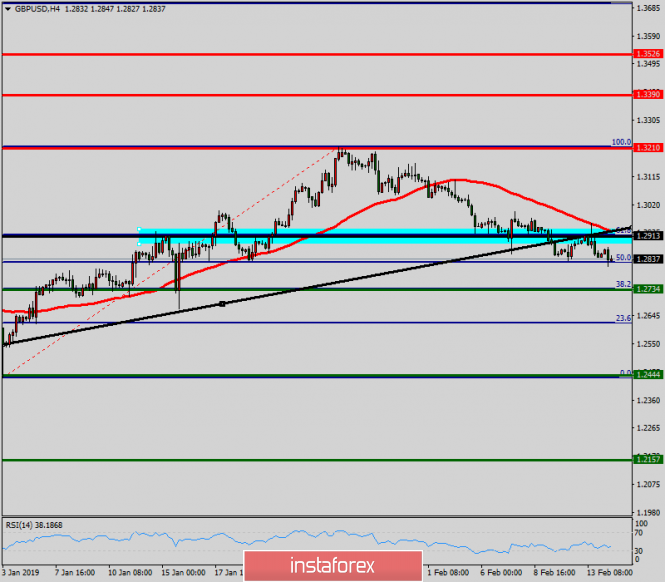
The GBP/USD pair continues to move downwards from the areas of 1.3210 and 1.2913 in the long term. Last week, the pair dropped from the level of 1.3210 to 1.2913 which coincides with a ratio of 61.8% Fibonacci on the H4 chart. Today, resistance is seen at the levels of 1.3130 and 1.3210. So, we expect the price to set below the strong resistance at the levels of 1.3130 and 1.3210; because the price is in a bearish channel now. Amid the previous events, the price is still moving between the levels of 1.3010 and 1.2734. Overall, we still prefer a bearish scenario as long as the price is below the level of 1.3010. Furthermore, if the GBP/USD pair is able to break out the bottom at 1.2913, the market will decline further to 1.2734 (daily support 1). Hence, the price will fall into a bearish trend in order to go further towards the strong support at 1.2734 to test it again. The level of 1.2704 will form a double bottom. On the other hand, if the price closes above the strong resistance of 1.3210, the best location for a stop loss order is seen above 1.3250.
The material has been provided by InstaForex Company - www.instaforex.com