
EUR/USD briefly peaked above 1.15 and as expected has turned lower. Like in early January as I explained in our last analysis, with the Daily RSI overbought and price at the 78.6% Fibonacci retracement level, the chances for a rejection and reversal were high.
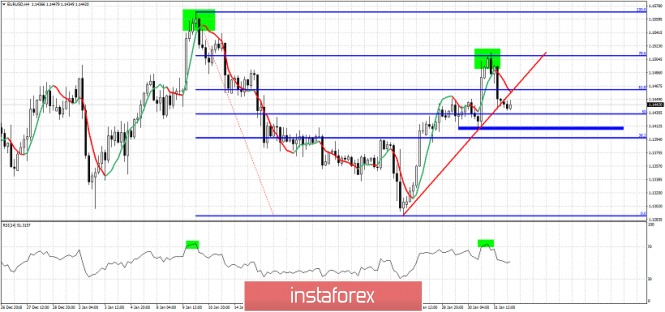
Red line - short-term support trend line
Green rectangles - reversal pattern repeating
EUR/USD got rejected at the 78.6% Fibonacci level and has also broken the short-term trend line support. Major support is found at 1.14. If we break and close the day below it, then we could talk about a similar reversal and bearish move starting like in early January when EUR/USD peaked at 1.1570. As long as EUR/USD is above 1.14 the battle between bulls and bears is still on. A lower high could have formed and this would be confirmed on a break below 1.14. This would be a very bearish sign. On the other hand, bulls want to see EUR/USD price break above yesterday highs and hold above 1.14. So far this pullback can be seen as a backtest of the break out area at 1.14-1.1430. Holding above it will support the bullish scenario. Breaking below it will open the way for a move towards 1.13 and lower.
The material has been provided by InstaForex Company - www.instaforex.com