
Technical outlook:
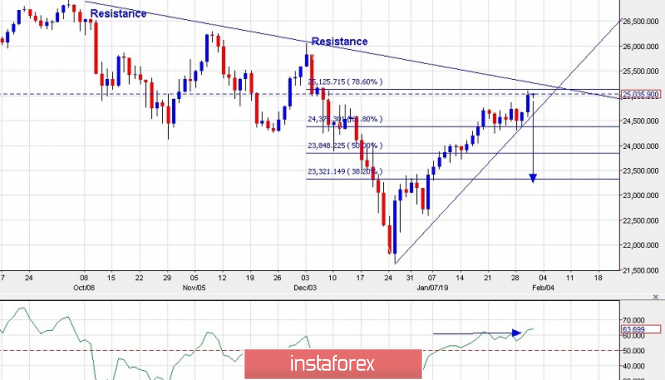
We have presented the daily chart view for Dow Jones since October 2018, to have a larger picture of the wave structure. As seen here, the Dow Jones has been forming lower lows and lower highs since October 2018, after having print highs at 26,950. It seems to have completed one trade cycle on the down side at 21,700/800 around December 2018, and since then has rallied in a counter trend, Please note that the counter trend rally has approached a confluence of resistances at fibonacci 0.786 and the sloping down trend line at 25,100 points. A bearish reaction can be expected around this price zone, and bears could be back again. Also note that the RSI on Daily is seen around the 60 mark which is usually the termination of a counter trend rally in a down trend. Please watch out for a bearish reversal here to initiate short position against 26,000. Until 26,000 resistance stays intact, the bearish view shall remain.
Trading plan:
Look to sell now @ 25,000 levels, stop @ 26,000, target @ 21,000.
Good luck!
The material has been provided by InstaForex Company - www.instaforex.com